


July Fundamental Analysis Note: Using Netflix, Tesla, TSM, and American Express to forecast what's coming next for markets
July Fundamental Analysis Letter for Members: We have arrived at critical earnings season
Note: To have a small celebration on J&J soaring 5% from my key level of 160 to nearly 170 earlier this week, which helped shield members from a softer broad market, I will also send out some premium content to public readers that will have its paywall removed for a limited duration. Be on the lookout for separate email today/tmr if you’re a public reader. I practice the good karma!
My Substack/Patreon Investment Community is very focused on helping our members have a thoughtful Asset Allocation as we head into a more contested market. Growing your net worth long term is as much about protection/preservation as it is about carefully capturing any advance.
Impatience has the potential to wreak havoc at this stage in the economic cycle. Slow and steady wins the race. That is my current mantra today and for the foreseeable future.
Members and Folks,
I hope you are doing well, and greetings to all new readers who have joined me here on Substack and in my social media channels!
Welcome back to another premium weekly investment strategy letter. This note will focus on Fundamental analysis now that we are in Earnings Season.
This week ending in July 21st was an important reminder of the value in knowing how to employ Sector Rotation. I am increasingly a believer that Sector Rotation is just as important as stock-selection. This goes with the concept that somewhere in the market, there is always a theme that is going through an accumulation phase. You just have to find it.
I’m not going to comment on the tech selloff yet because 2-3 days of market auction does not necessarily form an intermediate-term trend, but I will note the following:
Commodities/Natural resources themes like Oil & Fertilizers companies are exhibiting relative strength for nearly 2 weeks now
Health Care names JNJ and UNH continue to stay supported
Defensive retail stocks continue to stay relatively strong
Financials continue to be broadly supported
The first 3 bullet points were themes that I’ve expressed in the past several weeks that I believed to have the potential to have market-outperformance qualities.
As capital becomes more scarce and liquidity starts to drain, investors will have to be choosier. For this reason, I believe an “everything” rally (what we saw in May-July) will eventually turn into “ sector-specific” rallies (what we are seeing now). From there, fewer and fewer stocks within the sector will advance and this will make equities as an asset class less easy to invest in as we progress through Q3 and Q4.
And in the meantime, the broader 3 U.S. indices may be choppy due to the components shifting back and forth underneath the hood.
Moving onto Fundamentals
Let’s first take a look at the expectations that the Street has setup for Earnings Per Share for the S&P 500 in the quarters ahead.

We can see that the consensus calls for earnings to actually bottom right now, and that from here on out, the earnings per share trajectory will be higher. Much higher.
To put it simply, the S&P 500 has risen the way it has in 2023 due to these expectations given that the market is forward looking.
Now in my opinion, these estimates are far too rosy and I believe these estimates come from a scenario where rather than a recession taking place, we experience very robust growth.
We saw Netflix, Tesla, TSM, and American Express experience a bit of a setback post-earnings, not because their earnings were truly that weak but because the run-up leading into the event has been too hot.
In this note, I’ll share my thoughts on NFLX/TSLA/TSM/AXP, and then provide my thinking on how these names offer clues on what’s coming up next.
And of course, in each week’s Letter, I’ll keep highlighting a short list of stocks where I still see there being opportunity for upside (or directional movement) later in 2023.
Please note that at this stage in the market cycle, my primary strategy is to start setting Stop Orders on stocks when I see a 5-15% return on a name. This allows me to constantly redeploy capital into the market and force myself to find new fresh ideas when I get stopped out.
These ideas of course are always shared with the Investment Community folks in my weekly letters.

Let’s now talk Fundamentals and see what NFLX/TSLA/TSM/AXP tells us about the landscape ahead.
I have quite a bit of research and observations to share in this Letter.
It will hopefully provide you a holistic overview of the market and how to think about companies.
Earnings Discussion for Q2 2023 - NFLX/TSLA/TSM/AXP
Let me first do a quick summary of what I believe is important to look for when it comes to earnings season. Given that new folks join my Community at different times, I want to make sure everyone has an overview of my approach.
My approach is not overly complex - in fact it’s very straight forward. I believe that stocks move based on big picture themes and narratives, and that very granular details are unlikely to be focus points for institutional investors.
Here’s what I look for in individual companies across different lens:
An Investor’s General Thought Process On Fundamentals:
Is there increasing potential for more revenue expansion than previously expected? This represents Hope. Hope creates narratives. Narratives create excitement.
Are margins increasing or decreasing relative to expectations? This is a big factor in a DCF valuation model
What can we surmise about full-year EBITDA estimates? This is a big factor in a DCF valuation model
Are we doing more share repurchase? Are we hiking a dividend? This makes a company’s stock more valuable as it’s a strong signal to the marketplace of confidence
What is the outlook for Capex? This is a big factor in a DCF model as it affects Free Cash Flow.
What does this company’s results mean for the Sector, or the bigger theme at large? This plays into the Narrative, which the media then disseminates to slowly influence millions of readers. If the narrative is favorable, we’ll typically see post-earnings drift to the upside. If not, we’ll see post-earnings drift to the downside.
Applying this framework on Netflix, Tesla, TSM, and AXP - we will arrive at a couple conclusions.
I will also share my thinking on these companies later as some of them have tradable potential at key levels.
Let’s start with Netflix
Before Netflix reported this quarter, the Street had pushed NFLX to trade at 10X EV/EBITDA while organic revenue growth is in the 7% region year-over-year from the 3rd Quarter. That valuation metric of 10X EBITDA is expensive for a single-digit revenue growth profile. The company ignites hope within shareholders as there are new areas of revenue expansion (i.e. Paid-Ads / Paid Sharing). On top of this, NFLX is less impacted by media strikes that other Hollywood studios are.
Many people think NFLX is overvalued, and valuation-wise I can confirm that it is.
Based on my own estimates and today’s valuation, I think the Street believes NFLX will return to a 60%+ EBITDA Margin environment in the 2026-2027 timeframe.
For reference, Netflix achieved 65% EBITDA Margins in Fiscal year 2022 but their projected margins from 2023-2025 are in the 22-26% neighborhood.
In other words, today’s valuation is quite a leap of faith and my fair value estimate on this name is the 280-300/share region for investing.
BUT - there is a reason the Street values Netflix like this - Analysts are not completely irrational. It’s because Netflix has built an incredible operating leverage model in its business. Here’s what this means in plain english.
Operating leverage is when your expenses are relatively fixed, but your revenue is variable. This means your net profit can swing wildly depending on the outcome of your revenues.
Netflix has an annual projected range for its content development (its form of Capex). If Netflix’s Paid Sharing strategy works out well globally, then every single new converted subscriber after fixed costs are covered brings direct free cash flow to the company. In other words, Netflix’s business model is inherently levered around its projected fixed expenses. If paid subscriber growth surprises to the upside, Analysts will RUSH to adjust all the operating income estimates higher and Netflix’s stock will rise in tandem.
Netflix is a narrative driven name, meaning that I’ve noticed this stock tends to trade in regions well above or below its fair value. NFLX doesn’t typically align with DCF models given how volatile its subscriber numbers can be.
DCF models are best used on more stable companies where cash flows and EBITDA can be more easily predicted.
I’ve observed that the Street tends to materially lower or raise EBITDA estimates after every earnings quarter - which explains the large fluctuations.
My personal DCF estimate on Netflix implies that a Bear case could be as severe as 280-300 (using 22-26% terminal EBITDA margin assumptions which are already used for 2024-2025 estimates) per share but on the upside Bull case, Netflix can get to 500-525 (using 55-60% EBITDA margin assumptions).
As you can see, the range is very very large.
Remember: as Fundamental Analysts, never forget that the stock price is moving in conjunction with expectations surrounding future EBITDA.
The more uncertain future EBITDA, the larger the stock swings between quarter to quarter.
Netflix’s future stock price comes down to their subscriber growth rates as well as the success of their paid sharing plans.
If one wishes to trade NFLX, I will share my personal map down below. I see the high 370s/low 380s as a level I’m interested in to play a potential 3-5% bounce back to 390-395.
I’ll also watch the 410-415 area to see if a 2-4% intraday or swing bounce is in the cards back to 418-425 before further weakness.

Let’s now move onto Tesla
TSLA is now a very complex business. They aren’t just a car company - I’d say they are a sophisticated software/infrastructure company.
I’ve written about Tesla’s DCF value projections before - please read it. In that research note which I released a month ago, I talked about TSLA potentially reaching 300 and that would mark a dangerous zone for the stock (at least for the near-term).
At the end of the day, what matters most in a DCF model is the EBITDA growth and the EBITDA margins. These two factors have tremendous weight & importance in the valuation process of a stock like I will keep mentioning repeatedly in all my letters.
If a company comes out and conveys that they have projections of lowering EBITDA margins in the coming quarters - believe me - I am not interested in that stock on the long side during that news announcement as Wall Street DCF models will re-rate the equity valuation lower.
What happened with Tesla is precisely that - Elon discussed that they are facing margin pressure and this may persist for quite some time.
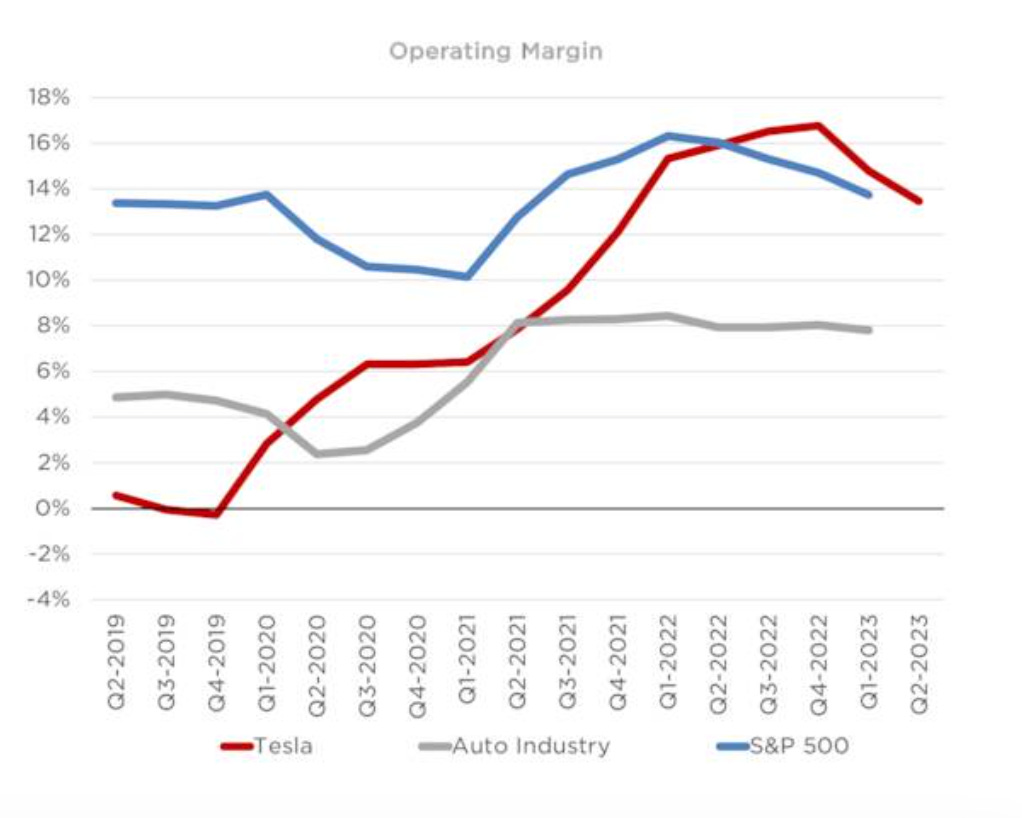
During highly contested moments, I’ve found that it is very hard to to make the right short-term call on heavily traded retail names like Tesla.
The greater the debate over a name, the more I now tend to avoid that battle.
I definitely like Tesla under 200. But I don’t have a strong opinion at this price level. At the right price, with a long-term view, Tesla is a winner.
The stock is still up significantly for the year and Buy Side Tech Portfolio Managers who want to protect returns may see TSLA as a candidate for risk reduction.
I would prefer to give guidance on names that fly under the radar and therefore have stealth rallies, which has historically worked much better for me - like JNJ, DLTR/DG/FIVE, TCOM, COST and many more low profile stocks.
On TSM: A signal for Semis
TSM is one of the most important bellwethers in the Semiconductor industry as their forecast for the PC/Electronics market has riveting effects for end-market companies AMD and Intel (and NVDA to a lesser degree) and the Semi-cap space AMAT and LRCX.
They recently reported weaker organic revenue and net income due to a softer electronics market. Their results aren’t a surprise to the Buy Side, but rather a fundamental reason to take profits on a sector that has been red hot.
In a previous note with image below, I discussed Applied Materials having a DCF value in the 130-135 region. This has served to be a magnet zone for the stock over the past 2-3 weeks. Every rally north of 140 on AMAT has pulled the stock back eventually to this level - with a slight degree of variance.
Long-time members know that I strongly use AMAT/LRCX as a proxy to understand future Semi sentiment.
With AMAT forming a double-top in mid July, it was a whisper of what may come for TSM Earnings. AMAT losing momentum also foreshadowed higher volatility in AMD/NVDA.

Now that TSM earnings are out with a rather tamed outlook, I expect Semis as a sector to stay subdued this quarter until AMAT/LRCX/NVDA reports in August.
In their management commentary, TSM indicated that they believe AI related chips could grow at 50% CAGR for the next 5 years. And AI will become low-teens for their revenue contribution a sizable jump from the 6% contribution today.
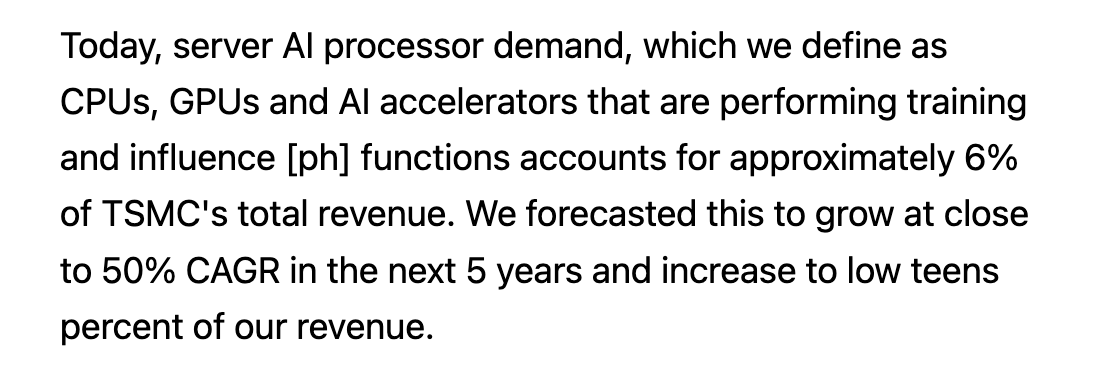
This blurb suggests to me that AI related stocks have significant investment potential for multi-year timeframes, and that any market dislocation that shocks the sector 10-15% lower is an opportunity to enter the space.
A 20-30% downturn in Semis would be a huge gift to long-term investors.
The Semiconductor SOXX ETF is still exhibiting a higher-lows (bullish structure) for now. However, the next several weeks as earnings season progresses will determine whether we are still in an uptrend or if we starting moving to a Lower-Highs structure.

The pattern that I look for is this:
AMAT/LRCX, which are the Semicap equipment companies, leads the Semiconductor SOXX ETF
SOXX typically leads QQQ
So, if AMAT/LRCX are soft, it’s only a matter of time before it’s reflected in SOXX, and then in QQQ.
Notice that in the past couple weeks, AMAT topped out first around 145. Then we started seeing giant gyrations in NVDA. And this week we saw a massive risk-reversal in QQQ from 388 (this week’s high) to 375 (this week’s close).
It all happened sequentially (in order) - not at the same time.
My bottom-up approach suggests that if AMAT can break past 145 again, there is no reason yet to get bearish on Semis.
If we break decisively below the 135 AMAT level, then I’m going to watch for the possibility of a 5-7% retracement in the SOXX ETF. SOXX is currently 510.
Anything between 135 and 145 on AMAT represents market indecision/chop.

Finally on AXP: A signal into consumer spending
Long-time Members know that American Express (AXP) is one of my favorite names in the market during select market environments.
This past week, AXP management reiterated 15-17% revenue growth for 2023 in their earnings update, and also highlighted that they expect about ~10% revenue growth in 2024.
For a U.S. economy that is slowing down, I find these growth rates to be very impressive.
Looking into the table below, we can see a bit of moderation in Billed Business growth rate versus analyst consensus but “30-day past due” percentages continue to be very low. Put together, these metrics still convey a stable spending environment as they reported that larger corporations and high income consumers continue to fare well in this environment.

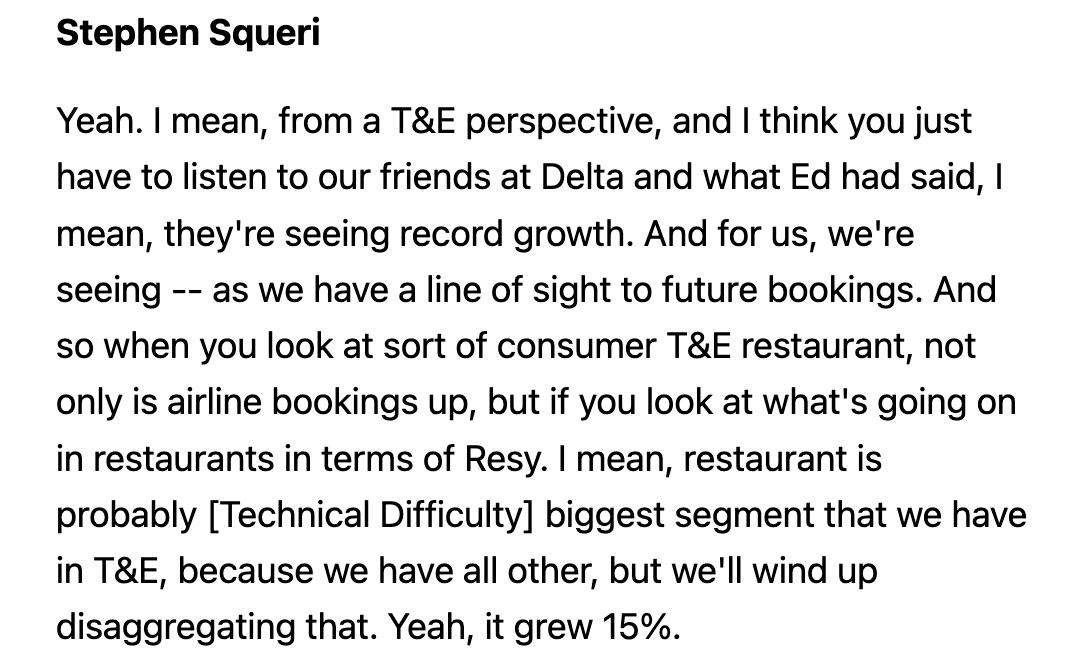
Here are a couple blurbs within their earnings transcript that I believe are worth following. Within their business, it is noted that T&E (Travel and Entertainment) is very strong. Meanwhile, AXP is noting that small businesses are moderating their spending activity and they’ve also highlighted that it may slow down.

In terms of investment implications, this suggests to me the following:
First, the strength in travel names Booking.com, Marriott, Expedia, Delta (and so forth) has potential further room to run even if they are near all-time highs (assuming no massive market selloff). Readers may recall that I discussed Marriott may revisit all-time highs back in May because many folks in Gen Z can’t afford real-estate, so what they do instead is spend their money on travel. This is a great reminder that some of my thematic ideas really do require time to play out. In the grand span of things, it really only took Marriott about 2 months to play out with my forecast, but we do need to budget at least an intermediate-term timeline (4-6 months) for such ideas to materialize. I do my best to position ideas to have them work as quickly as possible, but many times patience is required. See below.

Second, I believe American Express’ forecast on small businesses moderating growth and slowdown approaching could be fundamental information that determines that the Russell 2000 (Small Caps) is at a pivotal point. The Russell 2000 is trading at triple resistance at a time when American Express is talking about SME (Small-Medium Enterprises) slowing down spending. When we enter a slowdown (a matter of when and not) with confirmed data, I expect Russell 2000 to have relative weakness compared to the S&P 500. Small caps and their business models are much more sensitive to the economic cycle.

In the near-term, it’s possible that AXP revisits the 160-165 region. But looking out longer term, I see AXP reaching 178-180+ or better. Now 170.
What I’m doing during this blow off top - with markets near 2023 highs
I’m in maximum caution mode. In alignment with my views from previous letters, I have scaled down much of my equity positioning to await better opportunities. My positioning at the moment can be characterized as very cash heavy with my equity exposure in the defensive names that I’ve mentioned in my Letters over the past 2-3 editions.
I know that the last 4-6 weeks has made many market participants much more bullish on stocks. This type of blow-off top behavior can create serious FOMO among people as it seems stocks go up every single day.
But I do not believe stocks can (or should) go up every single day, as such patterns can create violent unwinds which can unnerve investors who are not used to a swift change in trend.
If we study the pattern of NFLX, Tesla, and Meta from this past week, they all exhibit a pattern of “Escalator Up, Elevator Down” type of reactions. In just 2-3 market sessions, about 10% of market value has been shaved off these companies.
Of course, for investors who were able to buy at/near the lows, these hiccups mean nothing. But many retail people have been buying in the past 4-6 weeks. A 20% drop in FAAMG/tech names from the highs can wipe out the melt-up gains that were made since June. That makes this earnings season especially important as I estimate there are a lot of people who have cost basis that look like META 280+, Tesla 250+, NVDA 450+, Apple 190+, MSFT 350+.
Not necessarily a hand of strength, in my view.
I will continue to identify tactical opportunities when I see them.
But I must be extremely selective as there are many traps being laid in the market at the moment. And sometimes, if there is nothing constructive, then we sit tight & observe.
Here are a list of names that I believe have opportunity in the coming weeks ahead. Some of them are in a position to move. Others we have to wait for levels to come back to us first. The July FOMC is this week, so no rush.
3-8% Capital Appreciation Upside Ideas within a 4-6 Month Period
Oracle (now 117): If a market selloff forces ORCL back to 109-110 to fill the gap, I see this name as an intermediate-term hold that can drift back to 117 or better. On other hand, in the absence of a broad selloff, I think ORCL revisits 121 or better.
TLT (now 101.7): As long as headline CPI doesn’t drift back higher, I think that TLT is very attractive within the 95-98 region. 100 is an ideal entry for a holding period of 6 months or so back to 108+. Today’s level isn’t bad - just know that it may not be the exact bottom. I gave 99 as an entry a few weeks back in the Weekly Dashboard during June-July timeframes.
Mosaic (now 38.6): I gave this inflation beneficiary name a second chance about 2 weeks ago when it traded 36ish before Russia pulled out of the Ukraine grain deal. Earlier in the year, I lost out on the opportunity to close at a gain. This time around, my 2nd entry in MOS is working but I will close if it breaches 35. This name is volatile but as long as it defends 35 in a selloff, I think it can trade back up to 42 or better by year end of Q1 2024. Today’s level is somewhat of a late entry. If an Investor is already in, Hold. If an Investor is not yet in, wait for pullback.
Starbucks (now 102): With the LGBTQ worker strikes now mostly fading, Starbucks has recovered from the pressure it experienced earlier this month when it traded 96-98. The name has earnings in early August and I believe any dip back to this 96-98 range is buyable. At some point in 2023, I expect SBUX to reclaim 108 or better.
Nike (now 109): Nike’s inventory struggles have plagued the stock for much of 2023. However, we formed a double bottom at 105 and if we treat 104-105 as a stop-loss area, our risk is rather manageable for the potential to revisit the 115 region or better.
Etsy (now 98): Etsy is the most speculative name on this list. If I see any large-sized sell back to 80-85, I would be comfortable with a longer-term position for a bounce back to 110 or better. At some point, I see ETSY reclaiming 110-115.
All names from previous week’s edition are still in play. I will move their ratings to Hold rather than Buy because many of them already moved up 2-5% this past week.
Once again, you’ll notice these are not the headline stock names or the stocks that most people care about on Twitter/Youtube/Social media.
I’m looking for the stealth movers within the S&P 500. The stocks that have directional action when nobody talks about them.
Our Investment Community format here is designed to benefit folks who have longer time horizons and can wait for ideas to play out in intermediate-term fashion.
Next week’s Strategy Letter will assess the July FOMC on market implications as well as share DCF analysis conclusion on a featured company that is going through earnings season.
Stay tuned. Stay liquid.
~Larry