DCF Modeling: Assessing Tesla's Upside and Downside after reaching a Feverish Overbought Level using Fundamental Analysis and Modeling
DCF Modeling Discussion: Using Fundamental Analysis to Reverse Engineer Implied Future Margin Expectations
Members,
What a great week this was for the Community. This week provided us a very active market and that opened up several trading setups which we were able to take advantage of as a Team.
I’m not going to rehash them in this note - you can read more about it here (open to the public until the end of this long Father’s Day weekend).
I think of my Community as a Sports Team. In any Sports Team, we are going to experience highs and lows together. The key behind long-term success is intensive preparation in the background and a continuous drive towards being a better Analyst, Investor, Trader, or Portfolio Manager every single day. Members will notice that my even though my work is focused upon arriving at investment conclusions, I also include language of investing/trading mentorship in my letters to help my readers practice a mindset that will build (and most importantly) protect wealth.
While I am happy to see folks benefit monetarily from my research efforts, I’m even more happy when people let me know that I’ve inspired them to become an Investment Research Analyst or even switch to a career in Finance.
For me, this is a telling sign that my work is touching people’s lives beyond just growing their portfolio account.
In today’s note, given the market context of being in a meltup, I’m going to discuss my observations of Tesla Stock after doing a personal DCF on the name. Just a reminder that my focus here is to discuss the results of my DCF model and that providing models is outside the scope in this Community tier (in the future if/when I have a DCF modeling course, I will show the full methodology).
What this note will do is conclude the following:
Apply 3 of the most valuable inputs in a DCF Model that I personally look for on Tesla (there are many important inputs - but these are my top 3 subjective inputs when it comes to looking at tech companies).
For Fundamental Analysts/Investors, to share scenario analysis of Tesla stock price outcomes depending on various business outcomes
Understand where the pullback levels may present an opportunity for Tesla shares and what region represents the stock trading at zones where retracements are more fundamentally likely.
Use Tesla as a barometer to understand the temperature of the current bull run by looking at implied future EBITDA margins to see if they make sense
Tesla is one of the most important names to keep on the watchlist as it is an indicator to market risk-on sentiment, and could provide clues as to what valuation inputs Wall Street is giving the name.
This note will be focused on understanding the big picture and assessing the Estimates that Wall Street has given TSLA. We will focus exclusively on looking at the forward estimates and reverse-engineering the implied growth rates that the Street is giving the name.
And best part is that it will be easily understood as I will do my best to avoid any technical jargon.
I firmly believe that looking at Support and Resistance levels is NOT as effective if you haven’t put in the work to assess the intrinsic value of the company.
The “Support” and “Resistance” Levels on Tesla will make much more sense after this analysis note.
Everything is written from a standpoint assuming the reader has never heard of a DCF model before and should be understand by all.
This note will be most appreciated by Members in my community who enjoy fundamental analysis discussion and applying that analysis to finding key levels for stocks.
Let’s talk about Tesla Fundamentals and Estimates
Before I get into the numbers, we need to first accept that Tesla is a wildly debated stock. It can be controversial due to the sheer variance of opinions and estimates, but the purpose in this note is to be as objective and factually-based as possible.
If you’re new to my Community, take a moment to read my broad framework for DCFs with Adobe as a case study. While there many inputs to study a company, I tend to focus on Revenue, EBITDA, and Capital Expenditure (Capex).
I’ve also conveniently made a page that neatly organizes the company-specific DCF notes I’ve written on it.
One of the things that we must always adhere to is this: the Market is never wrong about pricing. That said, the growth estimates and the EBITDA margin expectations that the Market applies to any given stock may be fair or unfair. As a result, my objective as a Strategist is to reverse engineer the implied growth rate and margins given the current stock price and fundamentals today.
Then, we can conclude whether the implied growth rates and margins make sense or not. That is by far one of the most objective ways to understand the meaning of the share price in the context of future expectations.
Okay with that said, I am going to share with you several key observations upfront that I believe you will find valuable.
Since the beginning of January 2023, I have observed that Analyst Estimates for Tesla Revenue forward estimates have come down about 10% in 2024, 2025, 2026, and 2027. I know this because back in December 2022, I had Tesla’s forward estimates written in my personal journal as I traded the name.
I am noticing that consensus Analyst Estimates for EBITDA, which stands for Earnings Before Interest Taxes Depreciation Amortization (my personal focus metric for a company’s baseline profitability), has also come down roughly 5-7% in years 2024-2027 since the beginning of this year.
During this same time period, the valuation multiple that the street prefers to use, which is EV/EBITDA, expanded from 20X on January 1st to 48.5X today.
So what does this suggest? It suggests that during the period January 1st 2023 to today June 15th 2023, much of the share price increase is due to valuation expansion rather than forward fundamental estimates increasing (because estimates have in fact gone down).
Is this irrational? No - not irrational necessarily - because Tesla did not deserve (in my view) to trade at 20X EV/EBITDA in the first place back in January 2023, which was the lowest valuation multiple it’s ever been offered at in its corporate history. For reference AAPL trades 23.3X EV/EBITDA today.
Thus, at initial glance, TSLA’s 2023 rally from 20X EV/EBITDA (100/share) to 48.5X EV/EBITDA (260/share) is viewed as pure bubble behavior but is actually comprised of several factors (not an exhaustive list):
Valuation normalization and mean-reversion effects
Short selling forced covering
Anticipation of a Fed pause, which prevents the Discount Rate - a metric that lowers future cash flow values - from rising too quickly
Tesla’s Price Cuts which may increase market share potential in the future
New initiatives with Supercharging Networks that deepen business moat
Potential to expand China production at Shanghai Gigafactory and opportunities to diversify supply chains to lower cost areas to increase profitability profile
Enthusiasm over A.I.
Now what I will do is run TSLA through my objective framework to assess the validity of its current fundamental estimates. Most important inputs in the DCF for tech companies are Revenue forward outlook, EBITDA and EBITDA Margin outlook trajectory, and Capital Expenditure considerations. Share repurchases also play a large role, but as of this writing, TSLA has not done share repurchases in 2023 so we do not need to discuss that piece.
Let’s first review the Analyst estimates for TSLA revenue growth.
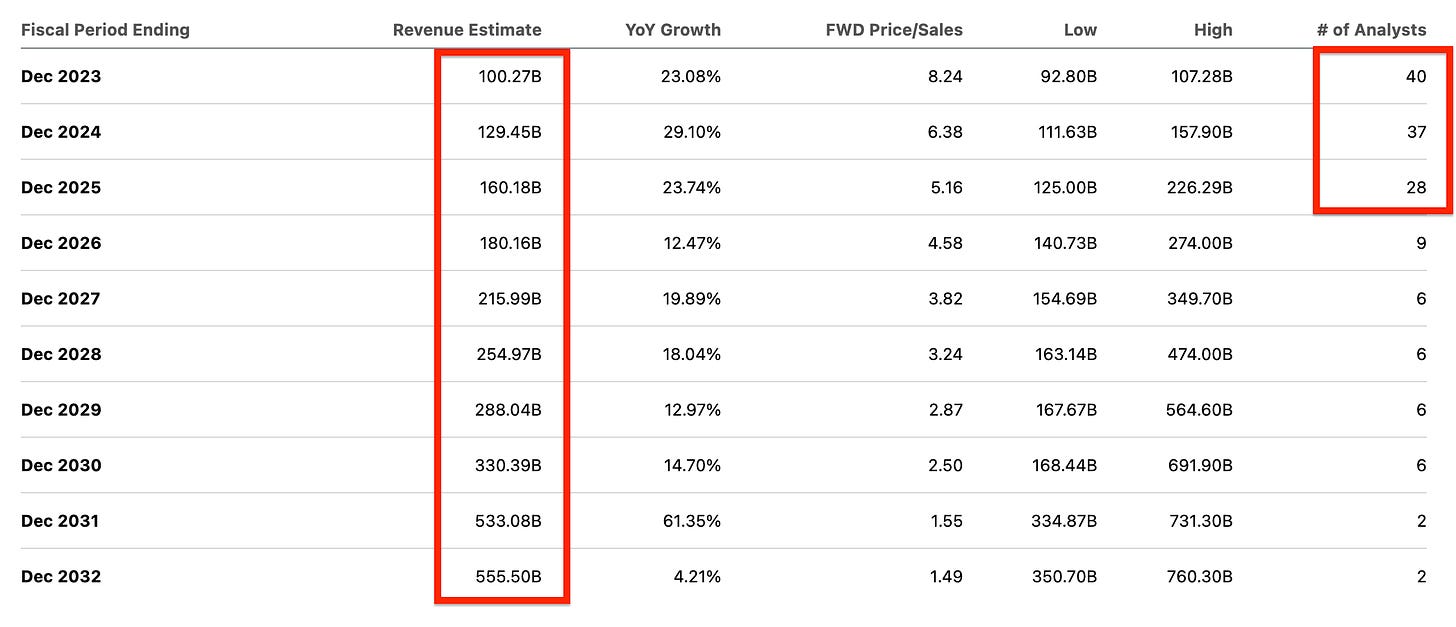
Commentary:
The Street sees 23-29% Revenue growth over the next 2 years. I view these rates as reasonable as previous years have routinely shown 30%+ growth or better. Elon’s pricing cuts on their Models may hurt ASP (Average Selling Prices) but will drive up volume to make up for it and end up with stronger market share. Additional initiatives by the company make these rates feasible.
As discussed in previous letters, the estimates for tech are most reliable when you are forecasting 3-5 years out. This is the reason you see most analysts focusing in this timeline (see above). Any forecasts that are 10 years out don’t have predictive value given the quickly changing landscape in this industry. For this reason, it is my hypothesis that Tesla stock is most sensitive to estimates over the next 5 years (from 2023-2027), and any forecast beyond this timeline isn’t necessarily used to value the company.
I don’t view other EV cars as yet posing threats to Tesla’s market share dominance (at least not yet). And, their strong relationship with the Chinese government suggests that Tesla is likely to be more popular among Chinese consumers compared to American car brands like GM. The Chinese market alone contributes roughly 20-21% of Tesla’s revenue.
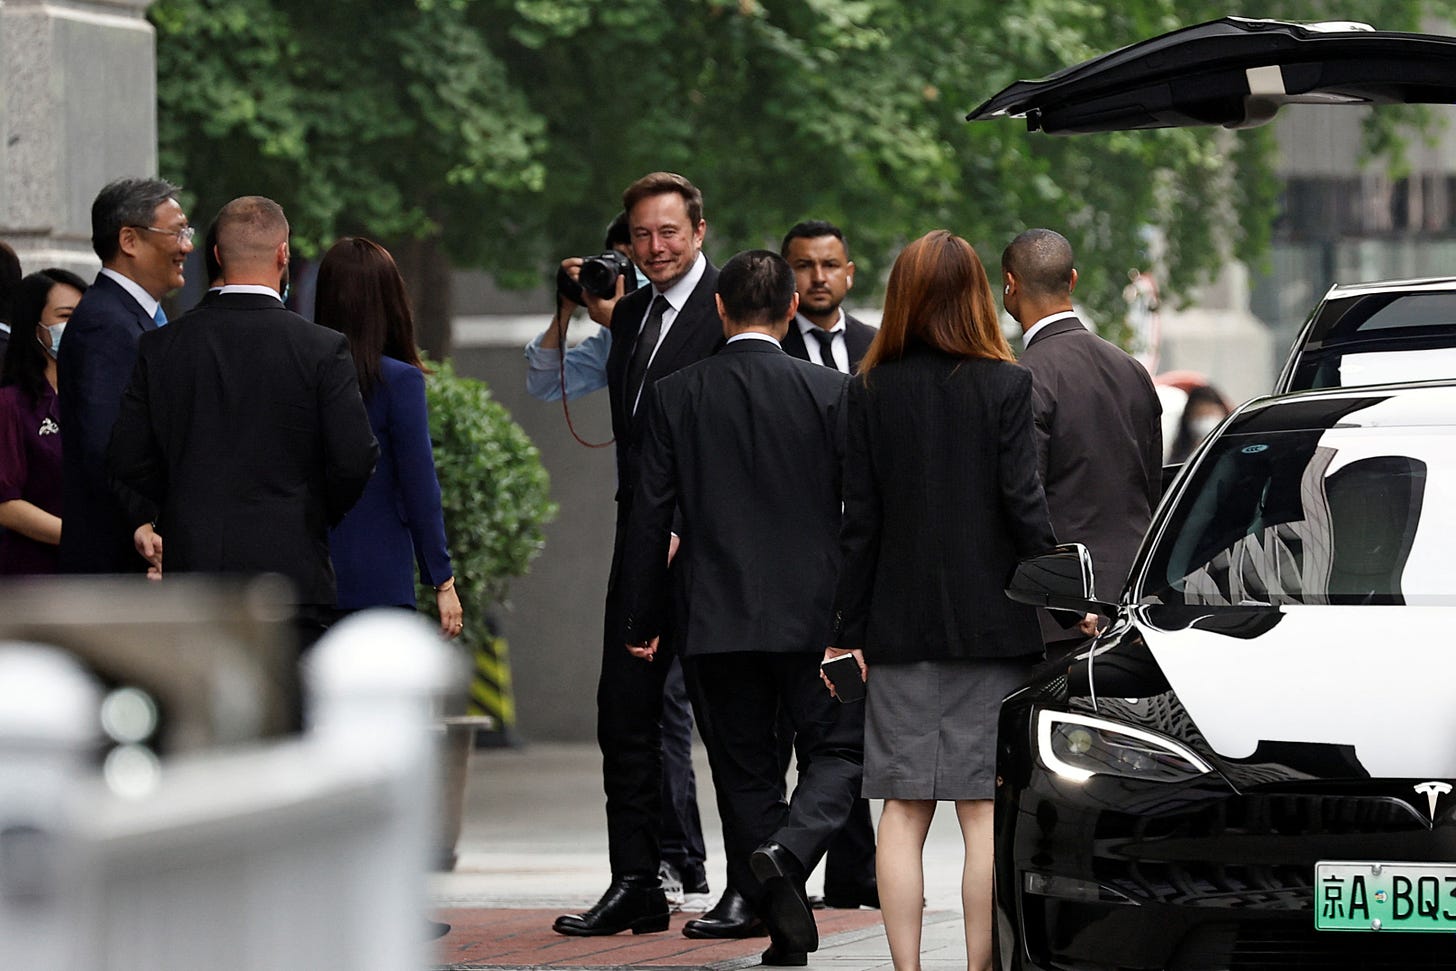
It is no coincidence that after Elon Musk visited China in late May, there was increased optimistic speculation that the Chinese government would approve expansion plans on its Shanghai Gigafactory. If such a deal is to be eventually signed, I would say that Tesla’s surge in the past 30 days has fundamentally backing.
Next let’s talk about TSLA EBITDA Analysis Commentary
I’ve discussed in my previous DCF commentary notes that I personally view EBITDA as the cleanest way to get a read on baseline profitability. It is even more important than EPS when analyzing equities, in my view.
We can see the Street was caught off guard with EBITDA forecasted to come to a grinding halt in full-year 2023 vs. 2022 and that caused TSLA’s stock to suffer in 2022 .
However, EBITDA Estimates are much more rosy in 2024 and 2025, with EBITDA estimates to double within 2 years from 17.66B in 2022 to 34.67B.
Given that Tesla is estimated to see about 19-21% (or better) EBITDA margins in the coming years, any rising EBITDA estimates combined with higher margins will make free cash flow go straight to the shareholder’s pocket. This is what the Street is hoping for.
My understanding of TSLA’s cost model in comparison to other EV makers is that their China production infrastructure allows them to save about 20% over other EV production models. This is a direct reason Tesla’s EBITDA margins are more attractive and therefore the stock commands a higher multiple compared to other EV makers like GM / Ford.
If TSLA is able to expand their production at the Shanghai Gigafactory, it is my belief that their competitive advantage with their cost structure will widen, and this will also assist with higher EBITDA margins in the next 3-5 years.
It is my personal belief that a long-term positive trajectory in EBITDA margins will lead to higher share prices.
Finally, let’s check the Capital Expenditure Outlook
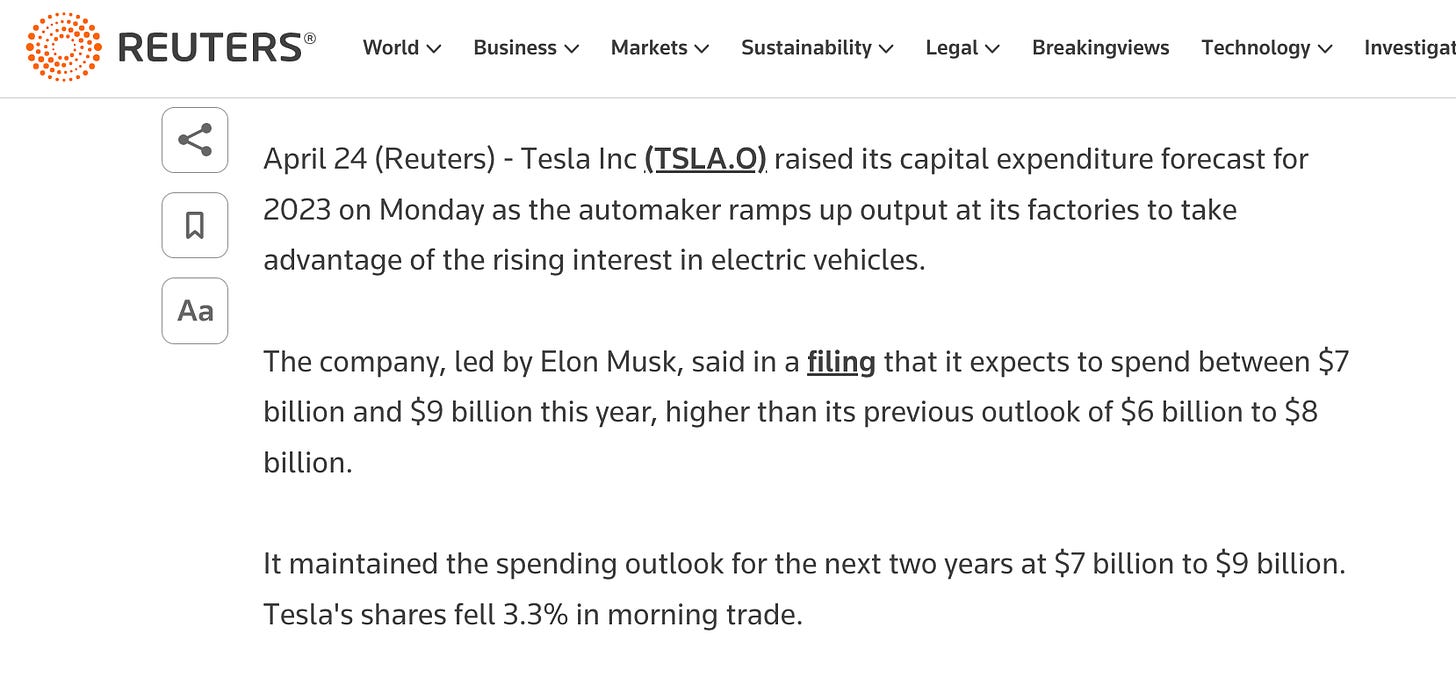
The last time Tesla announced market-moving news on Capital expenditure was in late April as shown below. The forecast is for the company to spend up to $9 billion on Capex in 2023, which would be about a 28% increase from prior year 2022 when it spent about ~$7B.
My analysis of the tech industry suggests that a progressive increase in Capex is healthy, but the Street does scrutinize the increase in Capex spending in relation to EBITDA growth to see if this takes away from profitability.
Back in April, we can see the direct impact of this Capex plan announcement on the share price shown above as it was not yet clear that TSLA’s EBITDA profile would greatly improve beyond 2023
However, Tesla’s growth prospects since this announcement has outweighed the increase in CapEx as the Street becomes more confident in increasing free cash flow from new initiatives such as Super Charging centers (as one example) and the possibility of increased production in China to lower production costs (thereby increasing EBITDA margins).
So with all this said, here are my Conclusions on Tesla Implied Growth Rates and Margins:
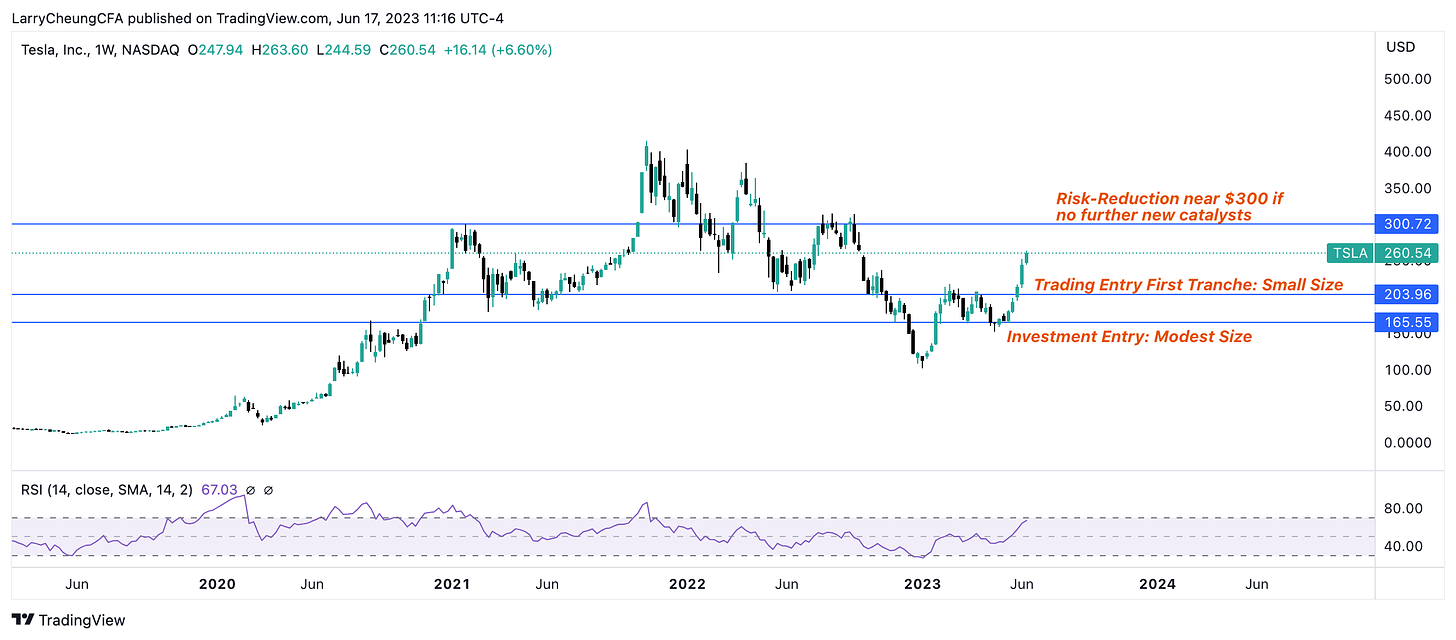
From a share price standpoint, Tesla is one of the most overbought stocks in the market using classical technical analysis. The Daily and Weekly RSIs which I often use to assess risk/reward is at very overbought levels. RSIs don’t guarantee a reversal but this type of momentum makes the stock more prone to a sudden reversal if there are any data points that can even moderately influence the perception of 2024-2025 estimates downward.
Elon’s relationship building in China has likely decreased Tesla’s equity risk premium compared to other high-beta stocks within the Semiconductor sector. Micron as an example is at the crosshairs of U.S. and China geopolitical conflict. A rising equity risk premium is not good for the stock price. A decreasing equity risk premium is good for the stock price.
Let’s look at the implied EBITDA Margins are under various scenarios if I use a conservative implied revenue growth rate of 10% (very achievable for TSLA in the next several years)
Today’s Level at 260: I reverse engineered what it would mean valuation-wise to buy TSLA today at 260-265/share using the current 48.5X EV/EBITDA multiple the market is giving the name
Assuming all other factors equal, It suggests that final year EBITDA Margins is around 14% (historically in-line with corporate history).
Therefore, looking out a multi-year timeframe, today’s level isn’t irrational. For trading, the stock may be too hot.
If TSLA gets to 195-200: I then reverse engineered what it would mean valuation-wise to buy TSLA today at 195-200/share using the current 48.5X EV/EBITDA multiple the market is giving the name
It suggests that final year EBITDA Margins is around 10% (on the lower side of Tesla’s recent performance history)
The 195-200 level is a price range that also happens to be a Support structure as seen in the blue line below.
With a multi-year timeframe, it’s unlikely that TSLA EBITDA Margins stay low at 10%. Therefore this level has a high likelihood of working.
If TSLA gets to 300: I also reverse engineered what it would mean valuation-wise to if TSLA were to get to 300-310/share using the current 48.5X EV/EBITDA multiple the market is giving the name
It suggests that final year EBITDA Margins is around 17% (getting close to the high side historically, but possible)
For reference, TSLA did 21% EBITDA margins in 2022 and 17% in 2021. Every other year was lower than these figures.
So, 300 per share is not only fundamentally a resistance level as 17% is at the high end of its corporate history but there’s also technical resistance there too (see below)
So here’s the bottom line: Tesla is very overbought on a technical basis but after doing this analysis, getting to 300 is not out of the question as terminal EBITDA margin of 17% isn’t entirely unreasonable. It just happens to be optimistic.
For me personally, I’m going to put Tesla on my trading wishlist at 200 and investment wishlist at 165.
The risk/reward of Tesla at 260 based on my DCF suggests a ratio of 1.5 to 2 where I see about 40 points of upside but up to 60 points of downside.
My thoughts on various TSLA Levels (based on today’s information set):
The 300 Level: If an experienced trader wants to scalp the remaining upside on Tesla, I sincerely believe it would be best to scalp the move on an intraday basis if there is clear relative strength and sell before the closing bell. Holding overnight risk on Tesla as we get near 300 is very high. Resistance at/near 300 should be formidable.
The 200 Level: Conversely, if for some reason we get a 200 level again (especially if it comes fast and violently), the risk of holding for a few days/weeks is manageable and the probability of a 5-8% bounce from swing lows is greatly increased.
The 230 Level: 230 is a minor support structure. We may see a 2-4% intermittent bounce there only if SPY/QQQ is stable. Minor supports aren’t my favorite setup.
The 150-160 Level: If we see 150-160 neckline support again in 2023, I’d say this is an Investment-Grade level and I will be buying it for long-term investment.
Remember, in a bubble market, traders who want to participate have one goal and one goal only: get a piece of the action, and then get out. Do not overstay the trade once you’re up a reasonable percentage/amount. Trading is not investing - the purpose is entirely different.
I don’t view TSLA 260 as yet an investment level, but purely for the most aggressive traders/scalpers. I’m personally not in that camp. I’m going to wait for 200, or not do anything at all.
160 or lower is a long-term multi-year investment level for TSLA. Do not trade that level. Just buy and hold it for as long as you can if you happen to like Tesla and the company’s vision for the future.
~Larry
P.S.: Weekly Dashboard will be updated on Dropbox before the markets reopen on Tuesday June 20th. Enjoy your long weekend. (This section here includes links and passwords)


