


China Investment Strategy (Technical Analysis): Starting to Approach Attractive Levels, In My View.
China Investment Strategy + NVDA Commentary (Technical Analysis): Premium Note to Members (With thoughtful and comprehensive preview)
Note to readers: This is a supplemental note in addition to my formal Bi-Weekly reports. Therefore it is designed to be concise. I know members appreciate additional updates, and I’m happy to share my observations as market internals make big differences from previous reports.
This note is focused on technical analysis (TA) of China’s internet sector as well as TA on NVDA and a few critical macro indicators. More detailed fundamental and Macro commentary is discussed in other reports.
Due to the recent market volatility (and the success of my recent opinions which I’m happy that members are experiencing), I will once again share premium notes released to the public. Find it below just before the paywall. Please be sure to share this email since I am providing exclusive content to you due to good karma.
If you are new to my Substack/Patreon community, just a friendly reminder that my investment strategy is categorized as Intermediate-Term Investing. Please click here to understand what that means.

Members,
Welcome to another concise strategy note in between my usual Bi-Weekly updates. I hope everyone’s doing good since my last update.
Since my last several notes released over the past weeks, quite a number of ideas shared by me have played out well in our favor.
As a quick summary:
In my late January note where I shared my bearish opinion on NFLX, Netflix has fallen from 360 to 320 since we discussed that it “will give back much of its gains”

January Premium Note Shopify has fallen from 53 to 41.
MU has fallen from 62 to 56
MSFT has fallen from 270 to 250
BABA has fallen from 120 (in earlier notes) to 92.
NVDA fell from 227 to 210, before its recent hype-driven post earnings bounce to 235 (discussed in much greater detail below)

A note on my methodology for reference (very important): When I mention targets, it represents my opinion that the level (or a vicinity very close to it) will be met/touched.
Whether it stays at that level is a separate concept. I cannot properly assess how long a stock will stay at a certain level, only that it will approach/visit that region. As long as markets are open, stock prices are fluid and are constantly moving.
The reason I must make this clear is that by issuing a target, once it is reached/very close (within 1% discretion), it is considered to be mission accomplished and I move onto a follow-up opinion.
Once again, I aim to have my targets achieved between 3 and 6 months given how ideas must require time to play out. This timeframe is unique to my assessment of the market. Sometimes ideas materialize faster, but I budget them to be intermediate-term in nature.
Those were some good opinions shared with the folks here, but now my focus in this note will be focused on 2 themes using technical analysis:
China’s internet sector outlook using Alibaba’s latest quarter as a proxy (technical analysis)
The bubble brewing in Nvidia that I believe will end very poorly (technical analysis)
I will walk you through the case behind why I think at certain levels (and what they are), China is a very compelling asset allocator to a well diversified portfolio.
I will also walk through why the recent U.S. Tech bounce led by AI optimism (namely NVDA) is on thin ice and risk/reward for the name has been as poor as I can remember.
As a cherished reader in my Community, here are the posts that references the opinions I mentioned at the beginning of this email with paywalls removed so you can read the whole piece if you wish. Join us below and be a part of my humble tribe.
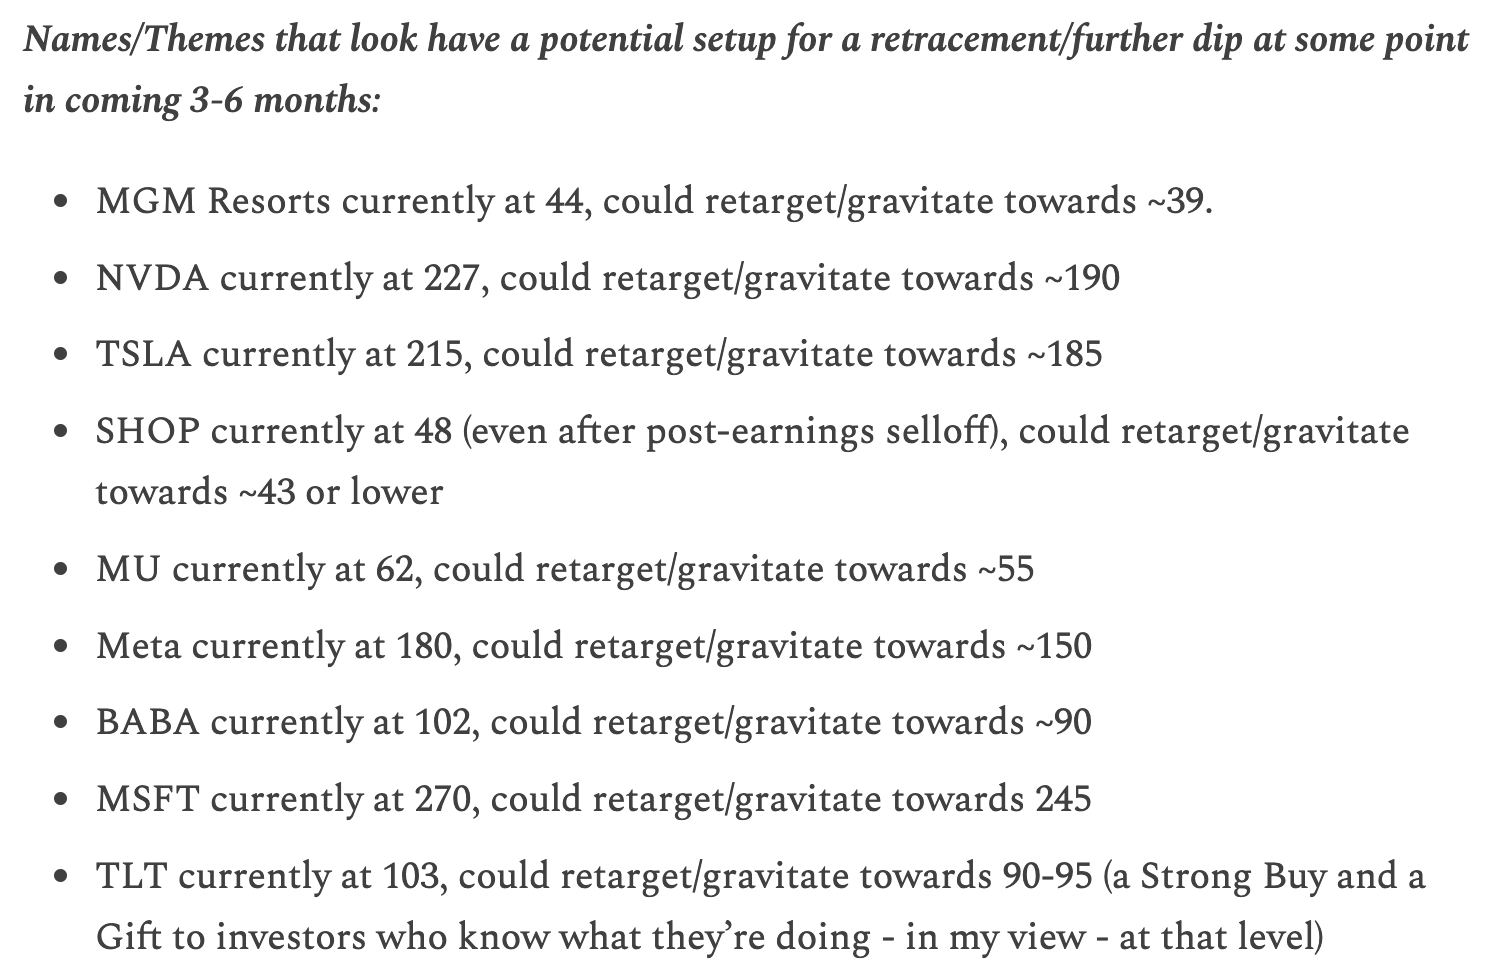
2/16 February Note to Members on retracement targets shown above (now mostly met for most names)
On China after Alibaba’s latest quarter (Technical Analysis)
If you’re new to my Community, make sure to take a moment to read my previous China notes for context to understand my macro and fundamental view on the sector.
My views in 2023 can be largely summarized as “near-term cautious during the 2023 China Rally but long-term constructive on a multi-year recovery.”
After you understand my macro and fundamental perspective (which I’m not going to repeat here because my previous newsletters have discussed this extensively), I’m going to use this as the structure of this note.
Technical Analysis with Conclusions (on Weekly and Daily Timeframes) on the biggest consumer name within KWEB: Alibaba. Will comment on other KWEB components in future notes.
Conclusions on Alibaba across different investment horizons (Consumer Proxy for China)
On the Weekly Timeframe (every candle represents 1 week)

Although investors may have an impression of Alibaba to be in a broad-based secular decline, the reality is that the name has traded between 80 and 120 for most of 2022 up until now (Feb 2023).
In other words, Alibaba is objectively in consolidation when we look at the stock from a multi-year timeframe (applicable for long-term investors).
Based on this technical premise and my macro view that China is in a multi-year recovery narrative, the bottom channel of the Weekly Timeframe at 75-80/share is likely to be a strong region to add exposure to BABA for long-term investment. This assumes that we don’t enter WW3 with U.S. & China.
Will we get under-cuts of BABA beneath 80? Yes, it’s of course possible. However, unless your macro opinion is that China is in secular decline, undercuts beneath 80/shr. are short-term fearful sentiment readings that do not change the longer-term recovery narrative.
On the Daily Timeframe (every candle represents 1 Day)

On the Daily Chart, which represents the stock’s price close every day, we are approaching regions where I expect Bulls to step in (at least from a tactical standpoint). This region is 85-95 as previously highlighted in my letters.
Several scenarios could play out here over the coming weeks for Alibaba (and the China sector at large):
Scenario 1: 94 is exact the bottom (ideal, but not the most likely scenario)
Scenario 2: A further pullback into 90, and then a bounce (which represents a 25% haircut from local highs of 120)
Scenario 3: A further pullback into 85, and then a bounce into 90-95, before consolidating/softening further.
Scenario 4: A deep pullback into 80 for a 20% bounce back to 95/96.
Conclusions from Alibaba’s technical setup (with my fundamental/macro opinions embedded)
Long-Term: Given the PBOC and China Central Government’s intention to assist the economy, I believe long-term investors who have the opportunity to buy BABA at 75-80 will be significantly rewarded over a 12-month timeline
Short-Term: BABA might wobble in the 85-95 region with the scenarios presented above, but ultimately, these levels (scaled in appropriately) should produce a positive ROI over a 6-month timeline (in my view). It’s just that it may not represent the cleanest bottoming structure.
Portfolio Considerations: China continues to have the macro support (discussed extensively in previous reports) that I’m always looking for before I issue opinions.
Risks and other considerations to my positive opinion:
On Regulation: If China Renaissance Banker Bao Fan is found by authorities to be in an investigation into corruption, I think the China internet sector will selloff, but I still like my 75-80 level for BABA. Anything lower than this level, and the forward P/E starts to get underneath 10X, which has historically presented an objectively strong accumulation period.
On Capital Markets: If the U.S. markets weaken significantly, as mentioned previously, the correlation of U.S./China markets is high in the short-term. Over the long-term however, the correlation becomes de-coupled. So make sure you understand the timeframe from which you make decisions.
On Geopolitics: If Russia loses the war against Ukraine (not my base case), the China internet sector becomes a Sell and my constructive thesis will be invalidated. If this happens, I will discuss why at a future point. I will not get into this at the moment.
On Valuation (Shown below): If BABA revisits 10X forward P/E or under (now 12.3X), I believe those levels will offer investors a very favorable entry point given a long enough investment horizon.

On NVDA After Latest Quarter (Technical Analysis)
Members will know that I think NVDA’s business model is quite sound, and I am a fan of their products on a personal level.
However, NVDA stock now has the following attributes (the most important ones that I follow) which I believe make it a very risky stock on the long side:
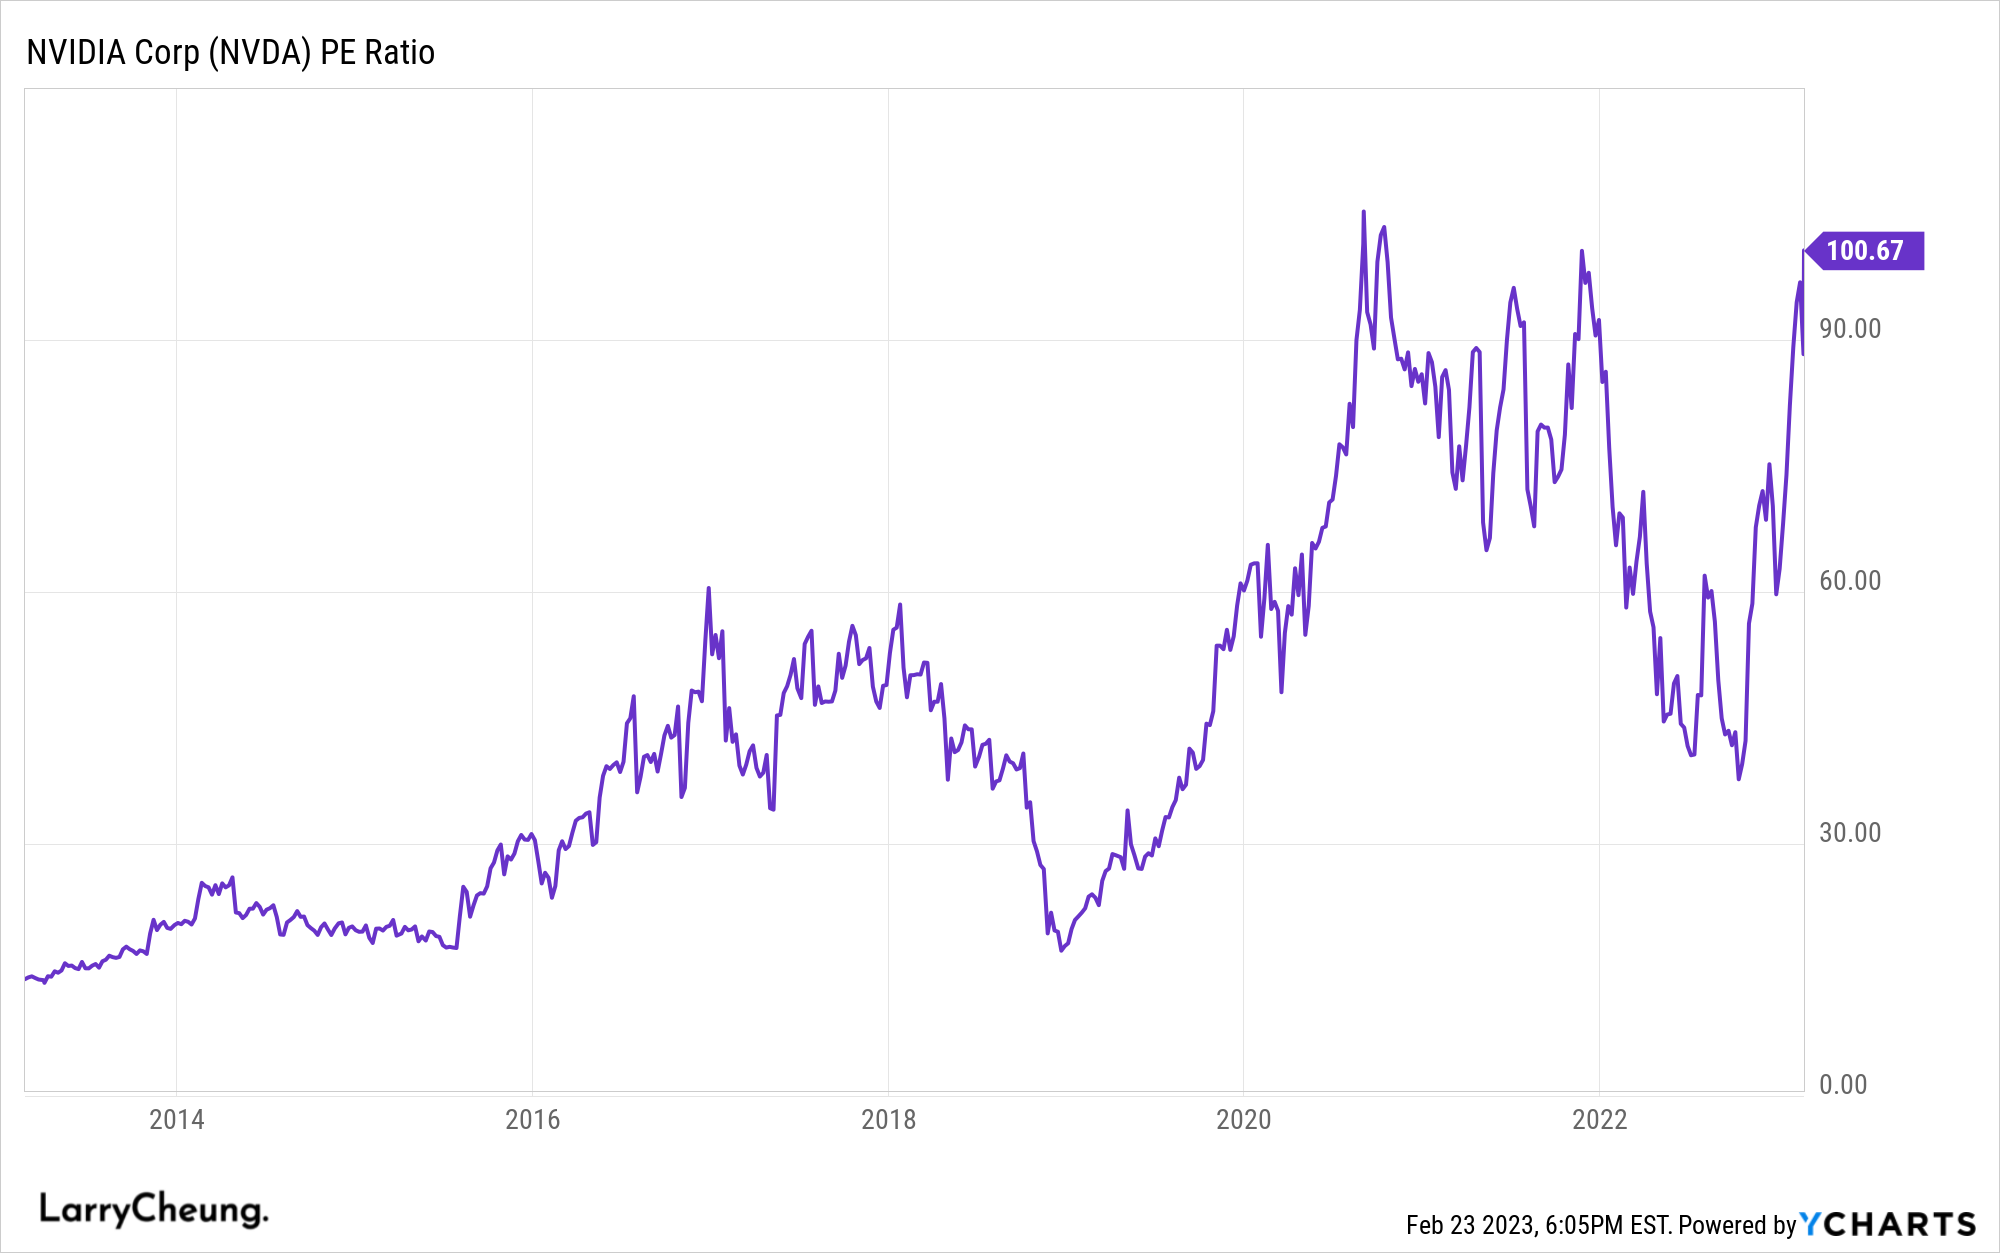
On a valuation basis, the stock is near all-time highs in terms of its P/E valuation multiples at 100X P/E
NVDA exhibits a Weekly RSI of 71.89 (where 70 on a Weekly timeline is overbought).

Brief Conclusions on NVDA:
Upon a bigger push to completely force short-sellers to capitulate, NVDA could be pushed as high as 270 (another 15% from here). However, this is not my base case. If NVDA were to trade to 270 violently (meaning, no consolidation), I think the entire market is setup for a sudden big sell-off.
Looking out 3-6 months, I personally favor a retest back to 195. Followed by 170. And then potentially 140 later in 2023. I have more confidence in 195 and 170. 140 will depend on a deep fear returning to the market. My levels are marked on the chart above. Even though the near-term trend is exceptionally strong, I believe late buyers here will not have much of an opportunity to exit as a turnaround in this frenzy could reverse at any moment.
My personal notes for myself:
For investing on the long side, wait for 170 for a first tranche re-entry, and 140 for a second tranche addition. 235 today is far too dangerous. 195 isn’t too appealing for me for an investment, but could be worthwhile as a trade.
On the short side, I personally think risk/reward looks good for short-sellers upon macro weakness but shorting NVDA should only be done by professionals with years of experience. Retail investors should ideally wait for buy-and-hold opportunities to emerge.
NVDA is up 65% in the first 54 days of 2023. This is highly unusual for a 500B market cap company, and indicates signs of market stress and not market health (from my perspective).
In other news…
The Dollar is at 104.5. A break above 105 spells trouble for the S&P 500’s 200 Day Moving Average.

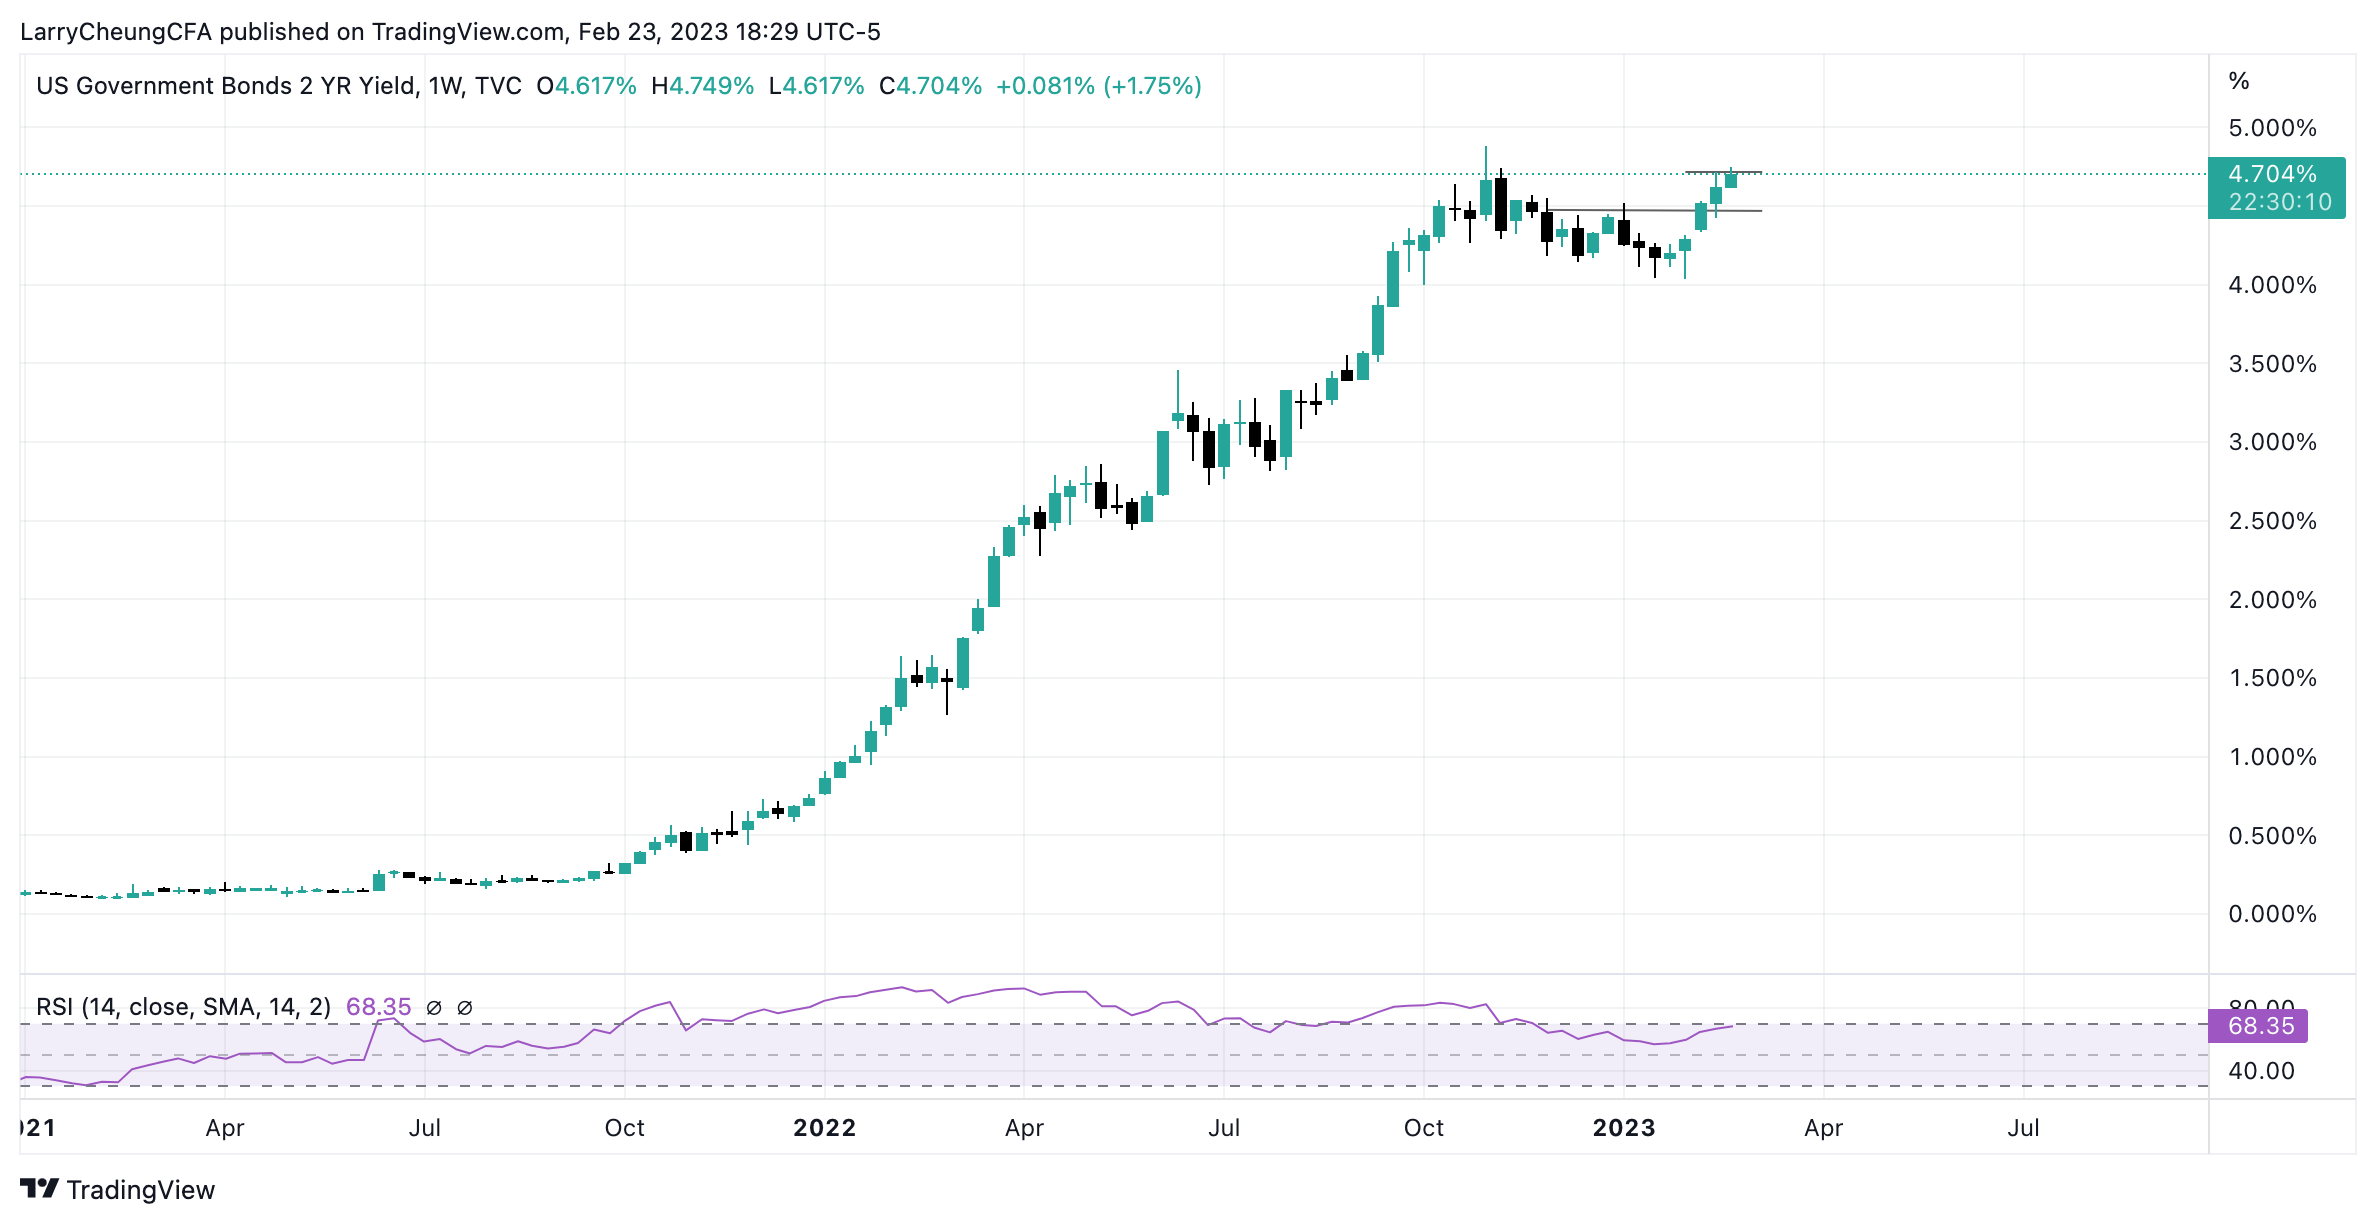
The 2 Year Yield is at 4.7%. Last time the 2Y was at 4.7%, QQQ traded 265 back in November 2022. QQQ is now 295.
The Junk Bond Market is testing the lower channel of its recent counter-trend rally. With interest rates looking to go higher than expectations, leveraged companies will see a level of pressure they haven’t seen for decades.

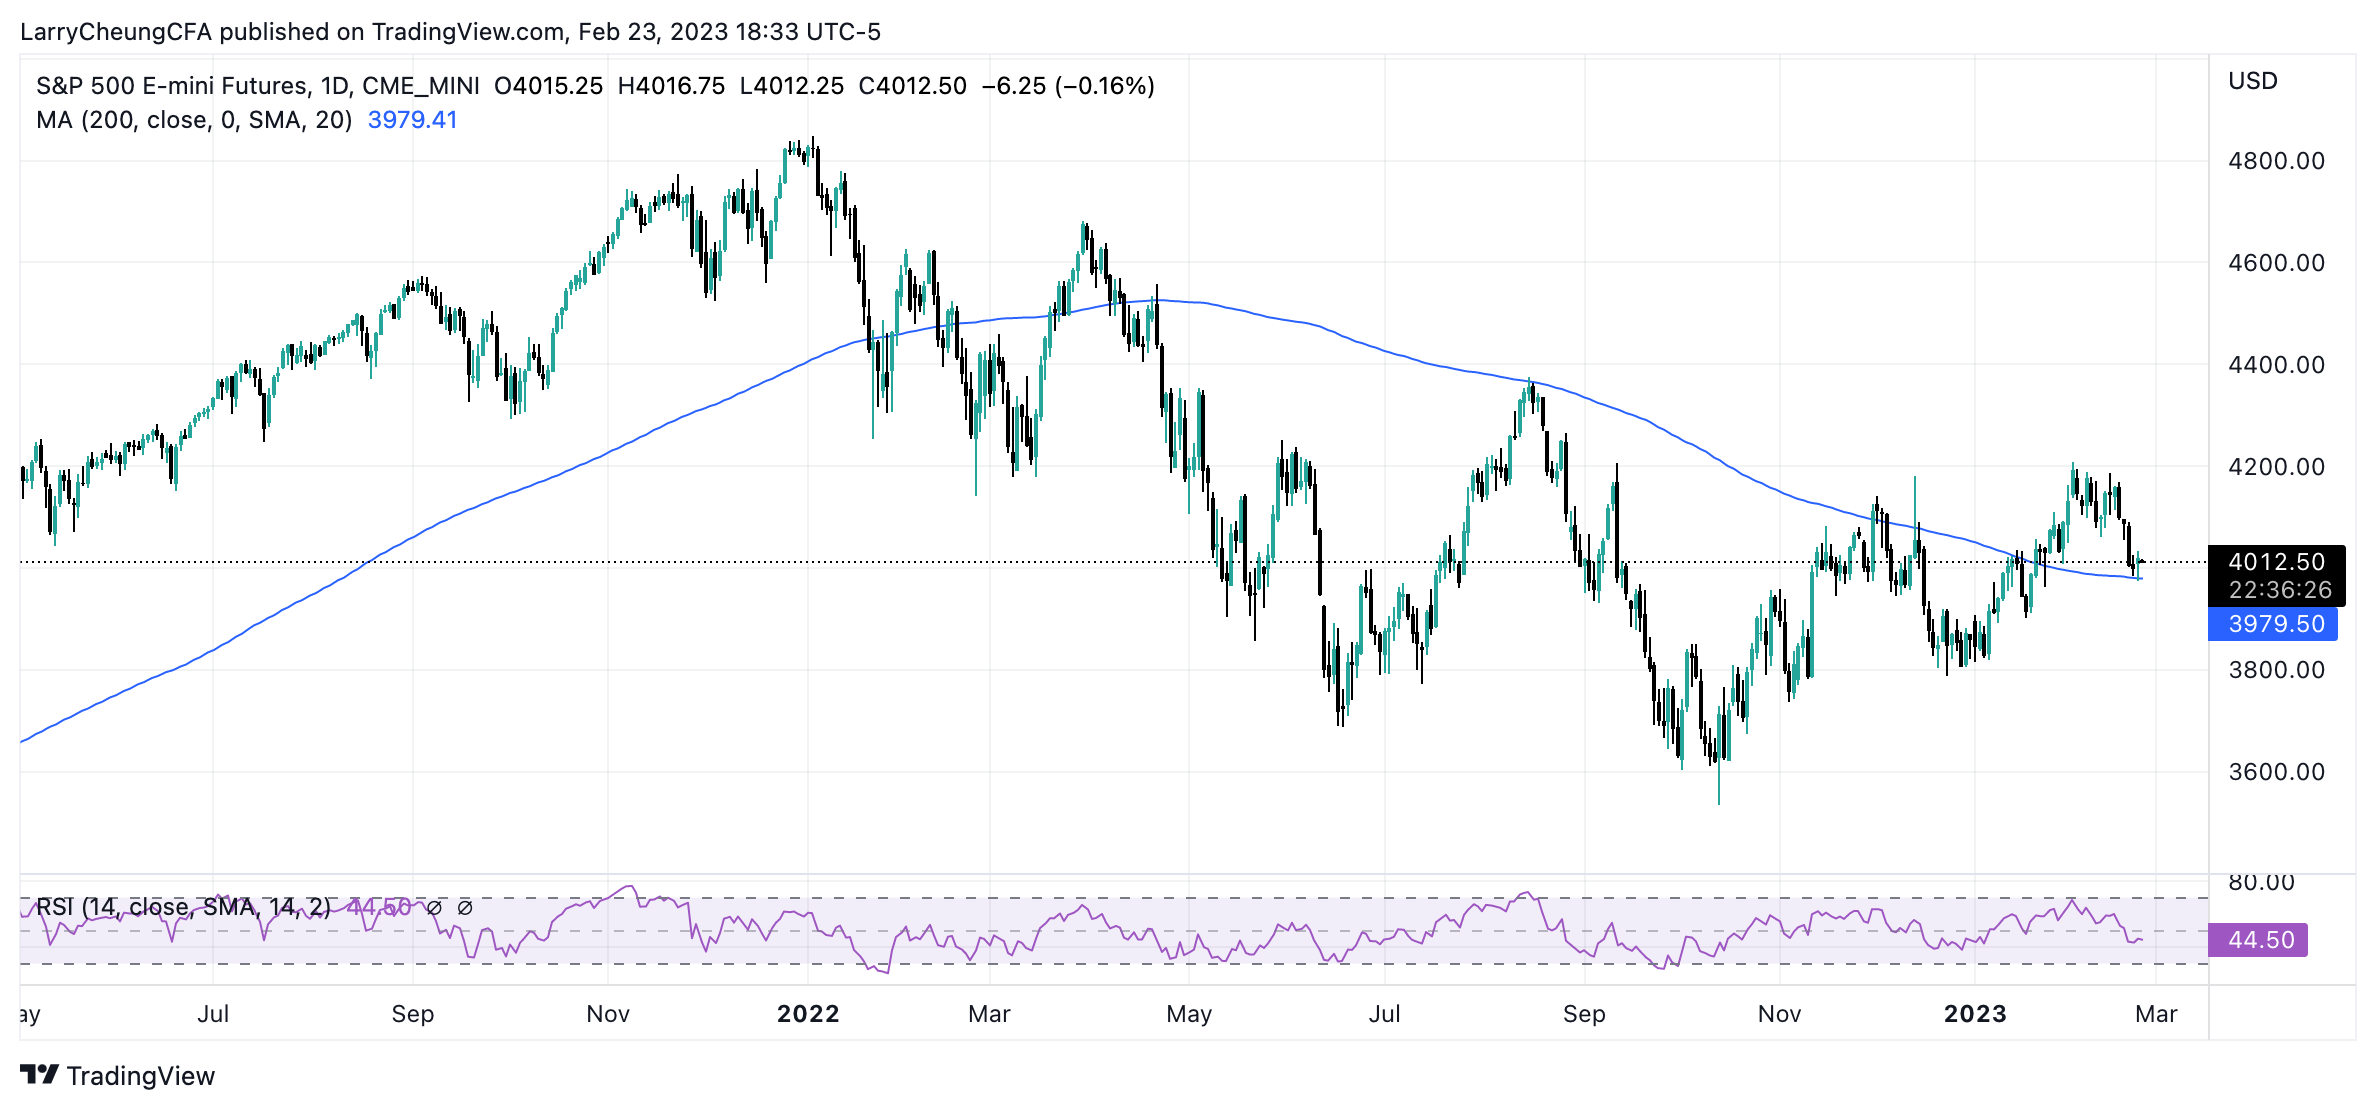
The E-Mini S&P 500 (Futures) is sitting on its 200 Day Moving Average
Final Conclusion?
I think you will have lots of opportunities later this year to buy stocks at much lower levels than today.
It seems improbable to me that the bounce led by valuation-rich NVDA today marks the beginning of structurally higher levels for SPY and QQQ.
Therefore, stay patient and if you really have to deploy capital because you can’t stand the idea of waiting in cash, then carefully eye opportunities in China where I believe macro support along with friendlier valuation will result in a strong(er) risk-adjusted return. I will continue to keep everyone updated.
Patience will serve you well,
Larry
P.S. If you enjoy my Community, tell friends and family. I will help you navigate the markets and help you find powerful accumulation opportunities as the environment allows. Thank you!
Recent Research Notes in Conjunction with this note: