Video Guide to Building Your Own DCF Model
I created this with members in mind. It's raw, unedited.
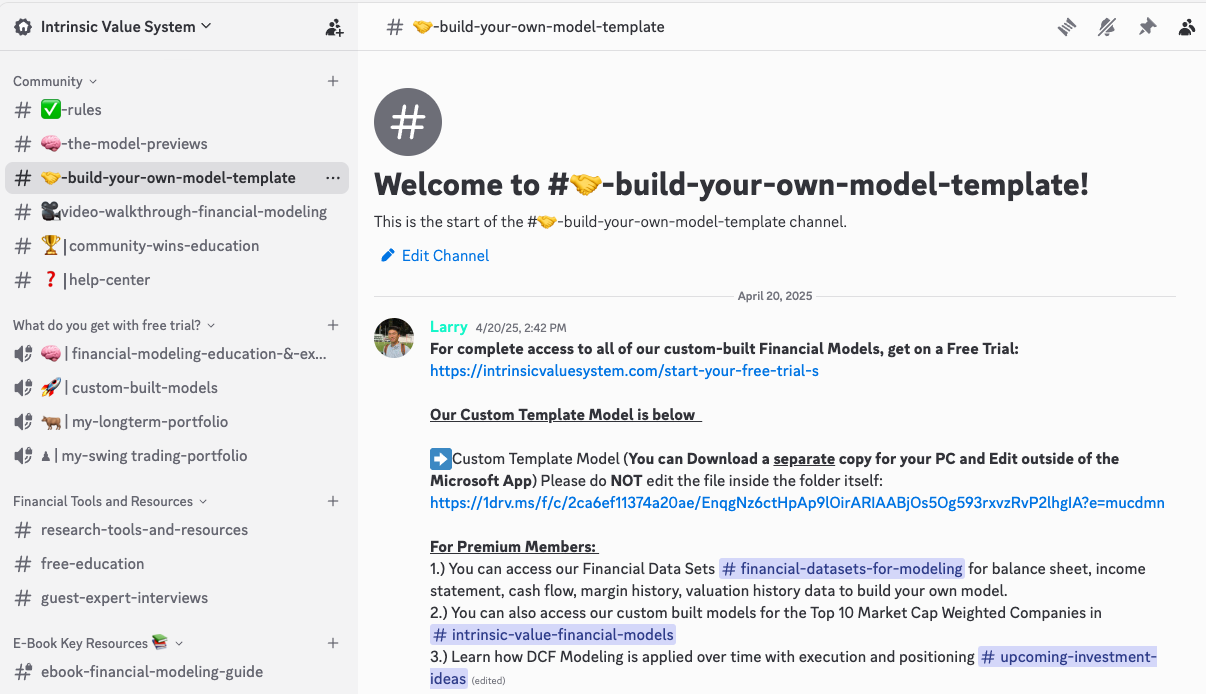
For our new Discord members (welcome to the 200+ of you!), I made an educational video (fair warning it is raw, unedited) that details out how I go about creating a DCF Model.
The 30-minute video walks through my process every time I give a stock idea and Key Levels that I’m watching.
And by the end of the video, hopefully it helps my friends here understand why on most stocks that I give targets for, they usually see favorable outcomes given a 3-6 month timeframe. Some serious due diligence and finesse is done to come to these DCF Conclusions!
Like I said before, financial modeling takes a few months to learn and 1-2 years to master.
But once you develop an Intrinsic Value System, it becomes VERY powerful. Very!
This video serves as a training video to create and build your own financial models using the custom templates that I provide inside my Discord (previous post).
It is raw, unedited. Sometimes in the video, I talk out loud as I go through my model building process.
Let me run you through a high level example of how this is applied with T-Mobile (TMUS). This was an actionable idea inside my Community.
Stop worrying about the P&L. Just trust the Process. Just give it Time. Trust YOURSELF.
I’ll walk you through a naked chart. Here is TMUS.
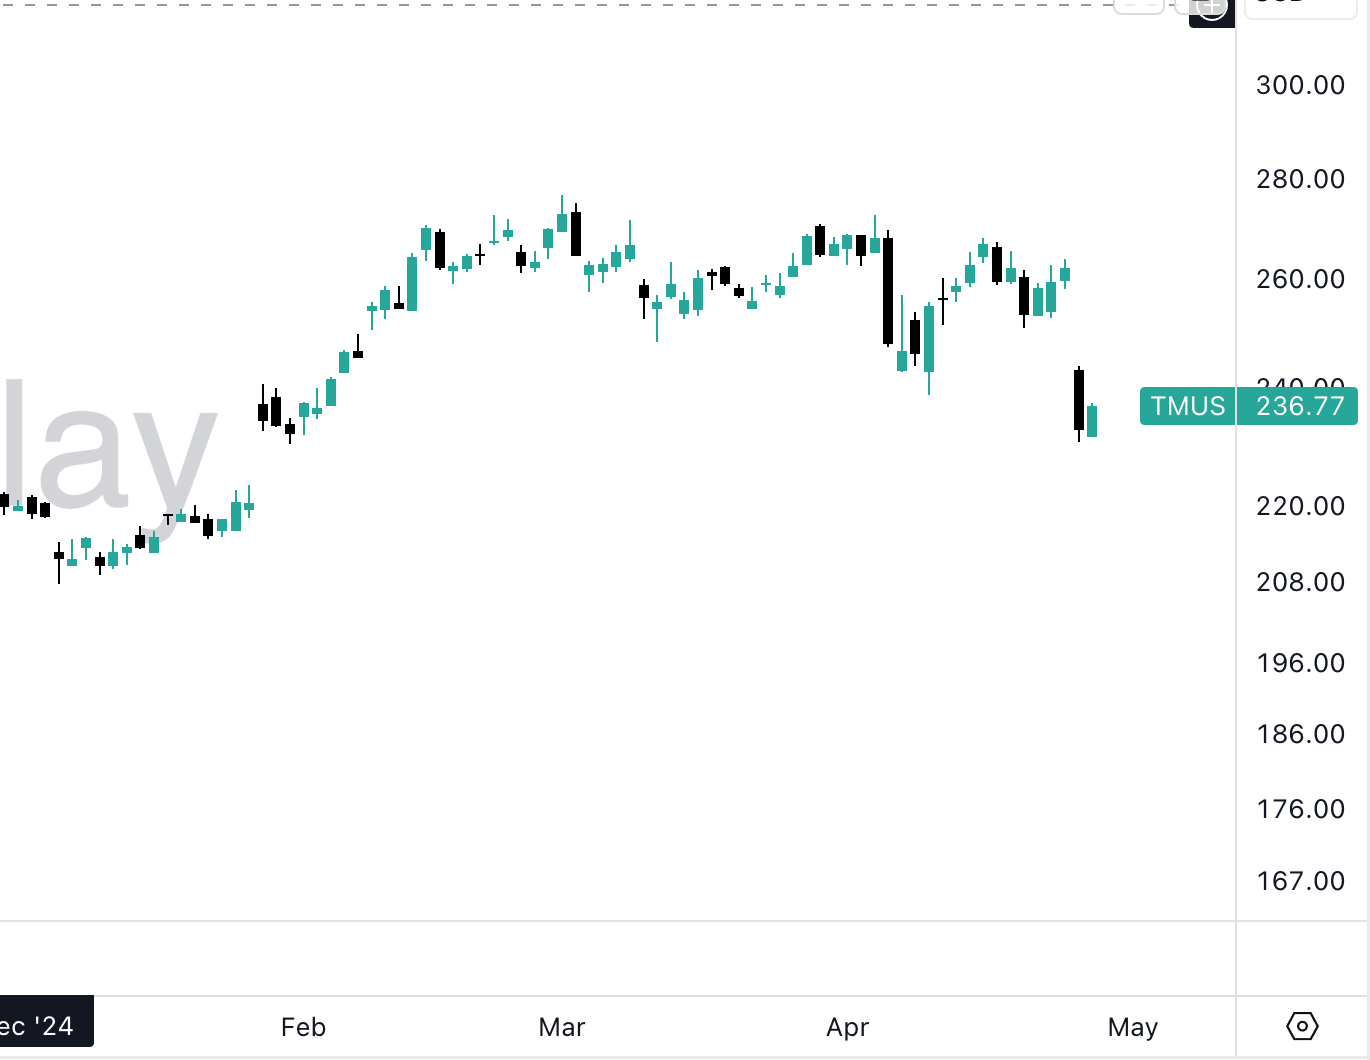
What might you notice about this chart? Well, it’s consolidating, and it also happens that we are revisiting an area where we last broke out.
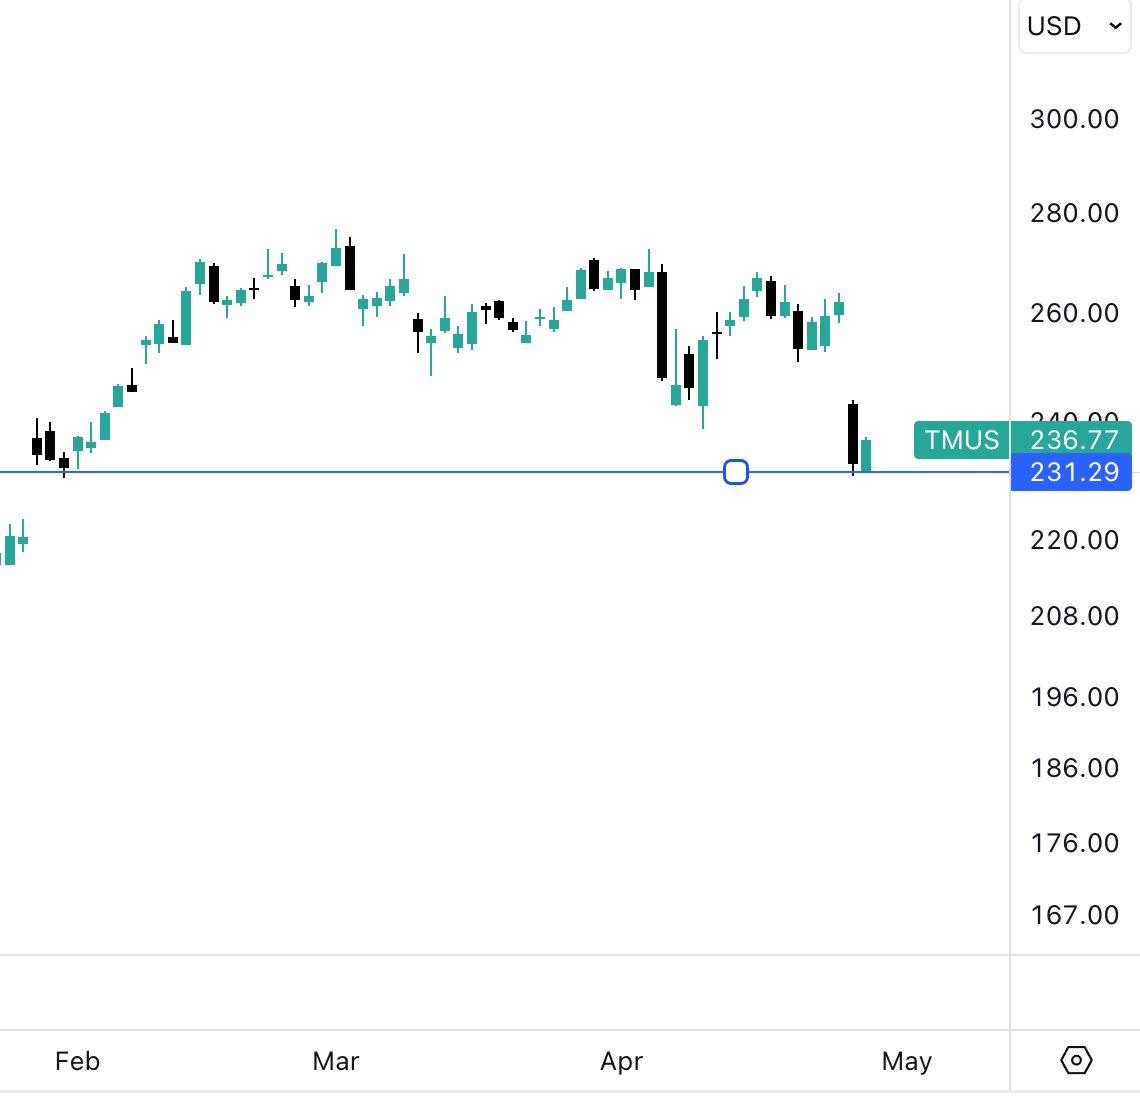
We can see this best with a Horizontal Support Line. Let’s keep it simple.
From here, do you have confidence in going Long the stock?
Statistics say that when you go long a stock at the point of a previous breakout, assuming the company is fundamentally solid, the win rate on this specific technical market structure is above 55-60%.
But what if I told you that when I look at the chart, I see this instead.
See below.
Rather than just plot lines, I’ve done a model on it so that I know what I’m actually paying for in terms of valuation and margin expectations at each price per share.
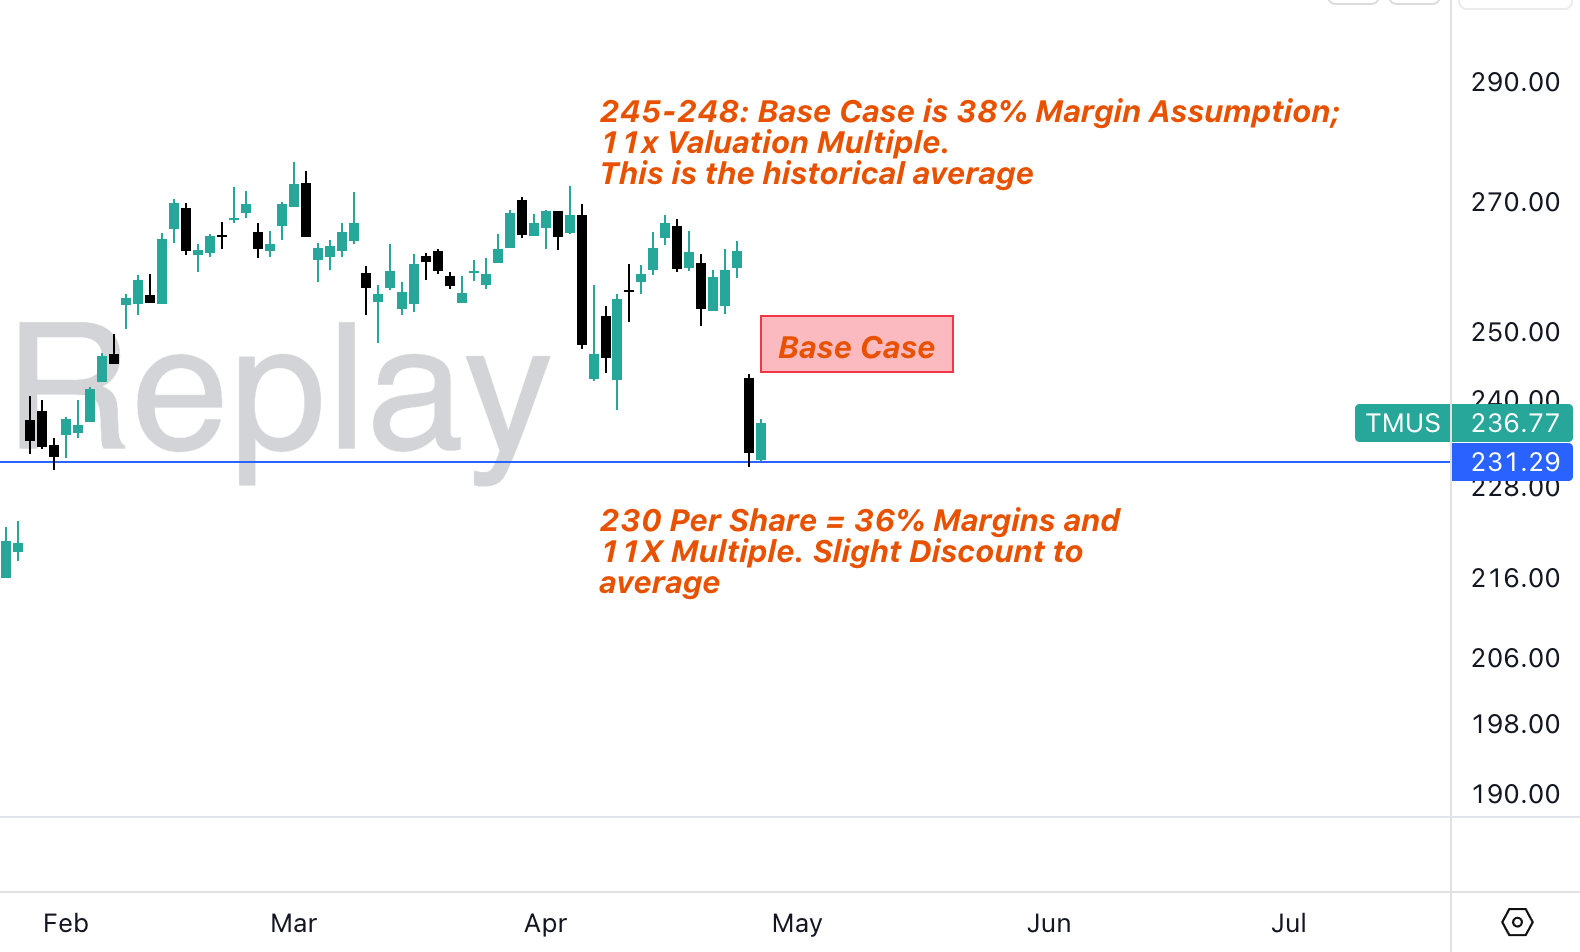
Psychologically, the naked chart at the beginning makes us only focus on what price we bought the stock.
After having done a model on TMUS, the chart with additional context makes us think “If I buy TMUS at 230-235, I’m buying at 36% implied margins when their recent quarter released indicated they did 38% margins. Given time, this should correct itself and TMUS should test 245-248 again.”
See what happens next (just a few days later).
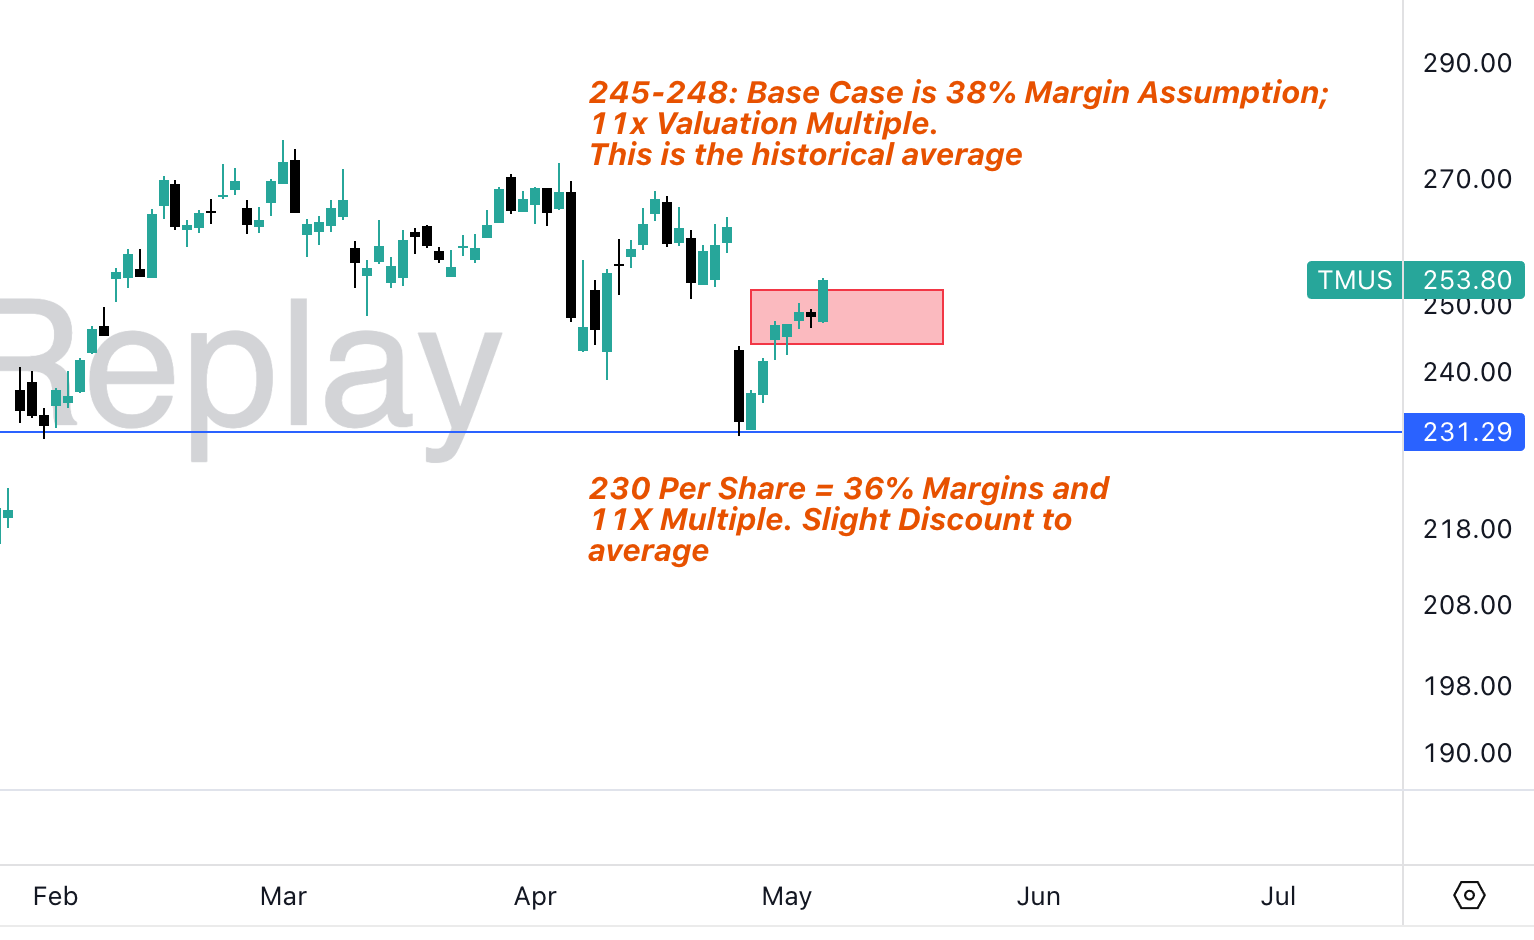
Limit Sell Order Filled.
Sequence 1 Complete.
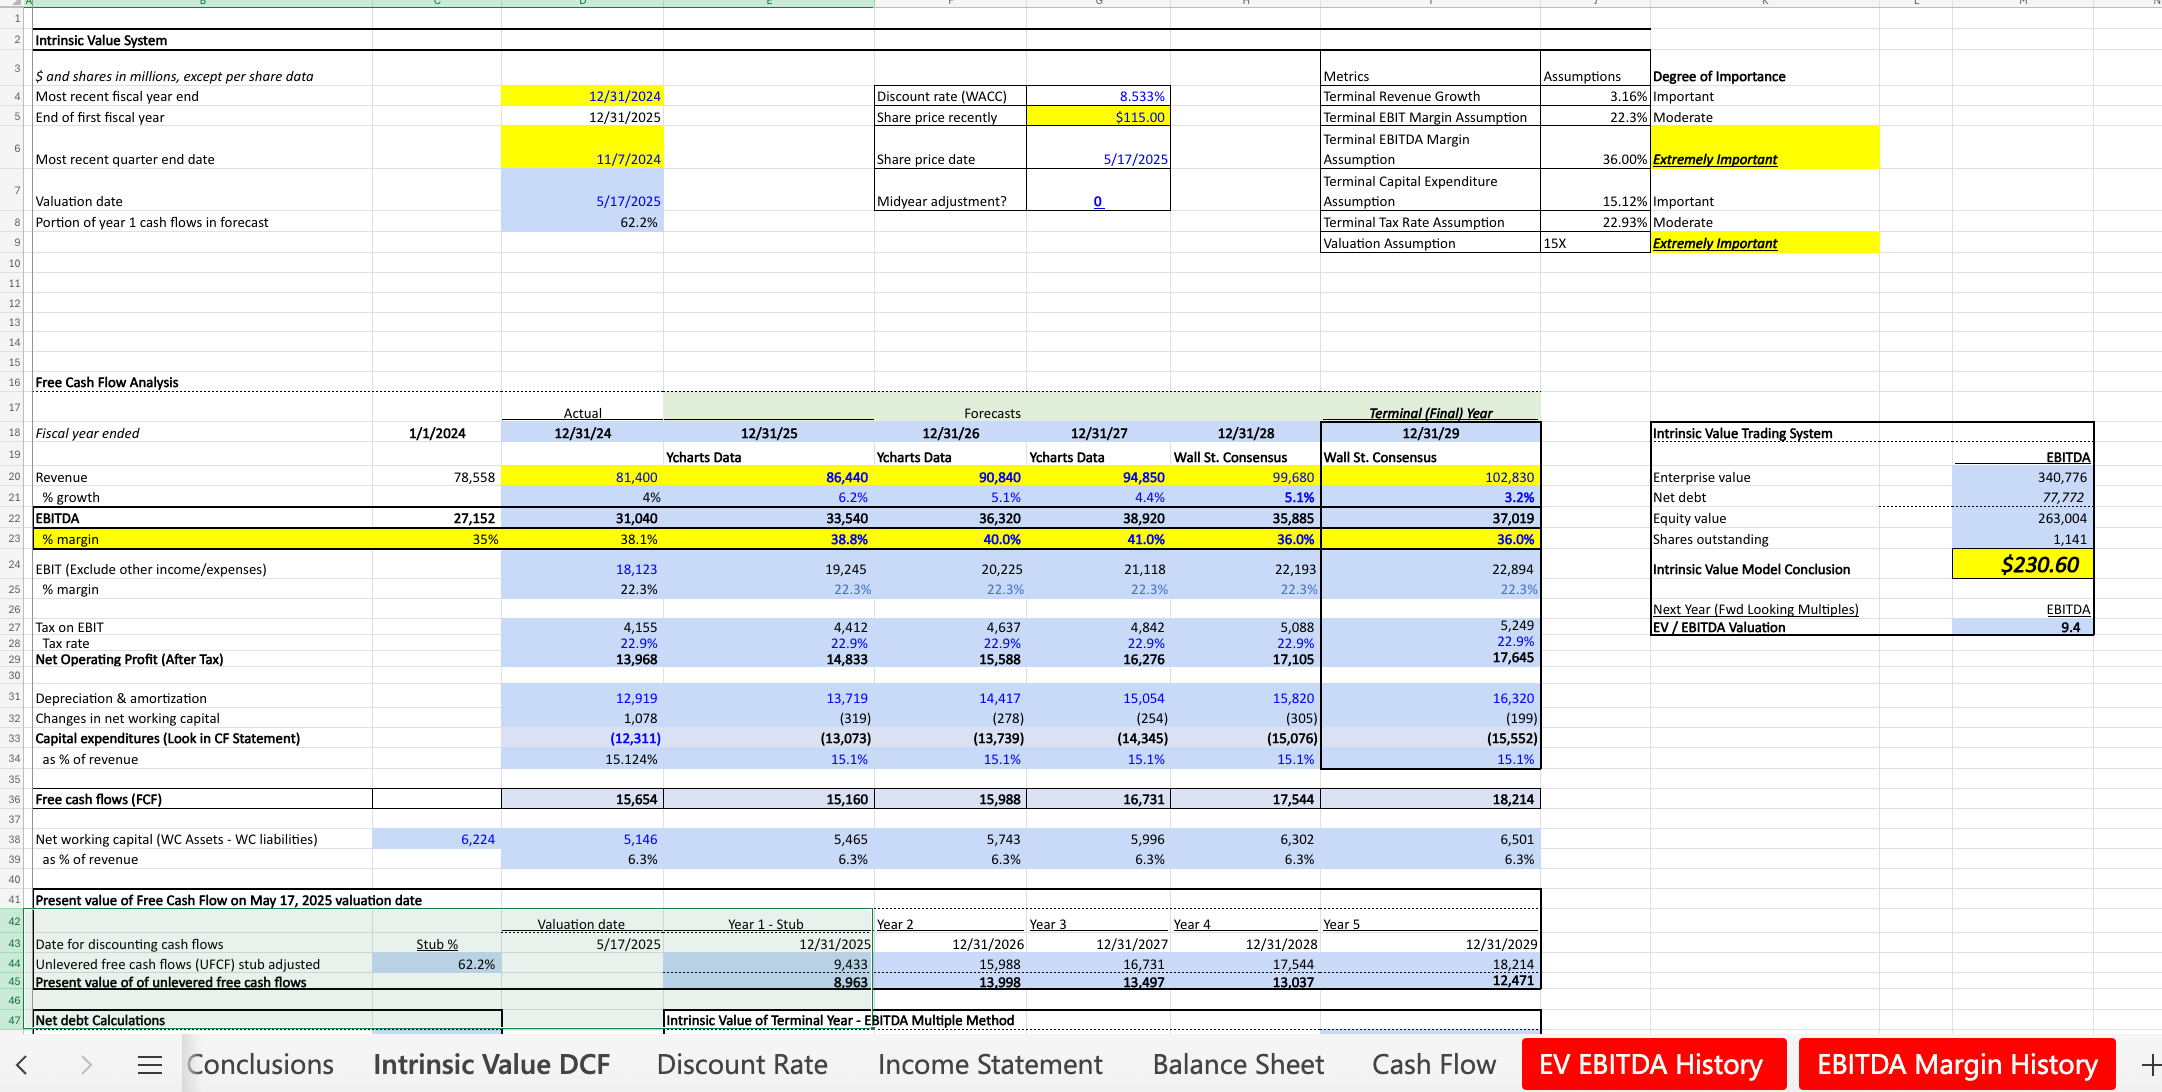
Now how did I come up with those figures?
Just like with all my ideas issued, I go through the intensive process of building out a financial model on it and crafting a Bear/Base/Bull case.
This is why I am selective in giving ideas in Whatsapp/Substack. I wait for great setups to appear. If there are weeks that are boring and inactionable, so be it!
I do serious due diligence before I issue any ideas. Because once I do, I know that my win rate can be as high as 65-67.5%.
So what is the value of financial modeling? See that TMUS has gone nowhere for 4-6 months.
Sequence 1: 235 → 250
Sequence 2: It went back to 235. Nothing changed related to the outlook, so I reloaded. Now it’s back at 243.
I spent 90 minutes building out the TMUS model.
I didn’t take a lot of risk. I bought 100 shares in Sequence 1, and 50 shares in Sequence 2 + 1 Call Option.
Those 2 sequences rewarded me with roughly $2000 total.
This is ONE stock I’ve talked about in the past 4 weeks. I think I’ve given out 8-10 ideas like this.
Sure the market has gone up, but let’s not forget I give ideas that work even in flat or DOWN tapes.
Is it worth learning financial modeling? Once you combine this with technical analysis, orderflow, and macro understanding, then….you have some serious edge.
Join the Discord (it’s free to join- I give a free custom template): there is education on how to build the model, access to download my custom pre-built models on the most important stocks, and SEE how I execute with this approach.
This isn’t just theory- it’s where rubber meets the road!
Once you get really experienced in modeling…you can even apply this to trading ES and NQ as you have a sense of where the indices can trade towards based on where the top 10 stocks Bear/Base/Bull cases are. The models to the top 10 weighted companies in the market are inside the Discord.
We’ve gotten a great surge in markets. Once the next dip comes, it will be Round 2 of Great Opportunities. Financial modeling will keep us patient and remind us to engage only when we believe there is some margin of safety.
FYI: We are well above the Base Case on almost everything (at least in my models).