


July Technical Analysis Premium Strat: Which names in the Market to watch & follow for tactical opportunity with upside remaining?
July Technical Strategy Note for Members: An update now that Markets are at 2023 Highs
Note: This Premium note for Members includes a thoughtful and comprehensive Preview for Public readers to understand my style and train of thought. Make sure to share this letter to your network.
I am sending this Letter earlier than scheduled because I have been invited to speak at a Real Estate Conference for the National Fair Housing Association and will be flying out this weekend to D.C.
Will post some photos on Instagram and Twitter!
I thought needed to adjust the timing of this week’s update, but am very happy to get it to you on/ahead of schedule!

Members,
The markets has entered a new stage in the advance where Sector Rotation has broadened out the rally, which has added credibility to the durability of this move.
In a prior note from late June where I attempted to provide an initial assessment of what’s in the cards for 2H 2023, I shared my observation that 426/share on the SPY ETF was my line in the sand for whether we see upside continuation or a pivot to break lower. That was my conditional level.
As long as that level held (which it did), my guidance to members was that I had to give the benefit of the doubt to the rally (even though I strongly distrust the underlying reason the market is going higher). See below.

In money management, our goal is of course to maximize the returns based on all available constraints. In personal finance, we need to accept the thinking from the famous book “Psychology of Money” that there is a threshold where enough is enough, and pushing for more brings unnecessary risk.
The key is to find the delicate between the two.
Let’s now recap what happened this week with my perspective as I share with you how I see the market. How you see the market may differ from me, but I now do believe it’s helpful to provide a recap given that my premium notes are sent out Weekly.
Recap of this Week
As we started the week and looked ahead to the Inflation data, the S&P 500 traded at 18.9X Forward P/E, which is roughly a 10%-12% premium from its long-term historical average.
From a technical standpoint before CPI, the S&P 500 also exhibited a double-top on the Daily chart, which is a powerful signal that if followed-through, may have marked a tactical shift in sentiment.
However, as powerful as this traditional signal is, it ended up being a trap which invited bearish speculators to bet on market declines - which as we know, just simply did not happen.
This week was a very difficult week for Bearish positioning or even market-neutral positioning. I am well aware of a large number of market participants (typically on the older side) who use market-neutral positions like Options Iron Condors and Strangles to take advantage of non-directional movement. Typically, those are high probability winning strategies when markets are trend-less. But this week, the market soared higher and market-neutral saw adverse outcomes along with bearish positioning.
Throughout the week, I observed positive and constructive commentary from Janet Yellen’s trip to China.
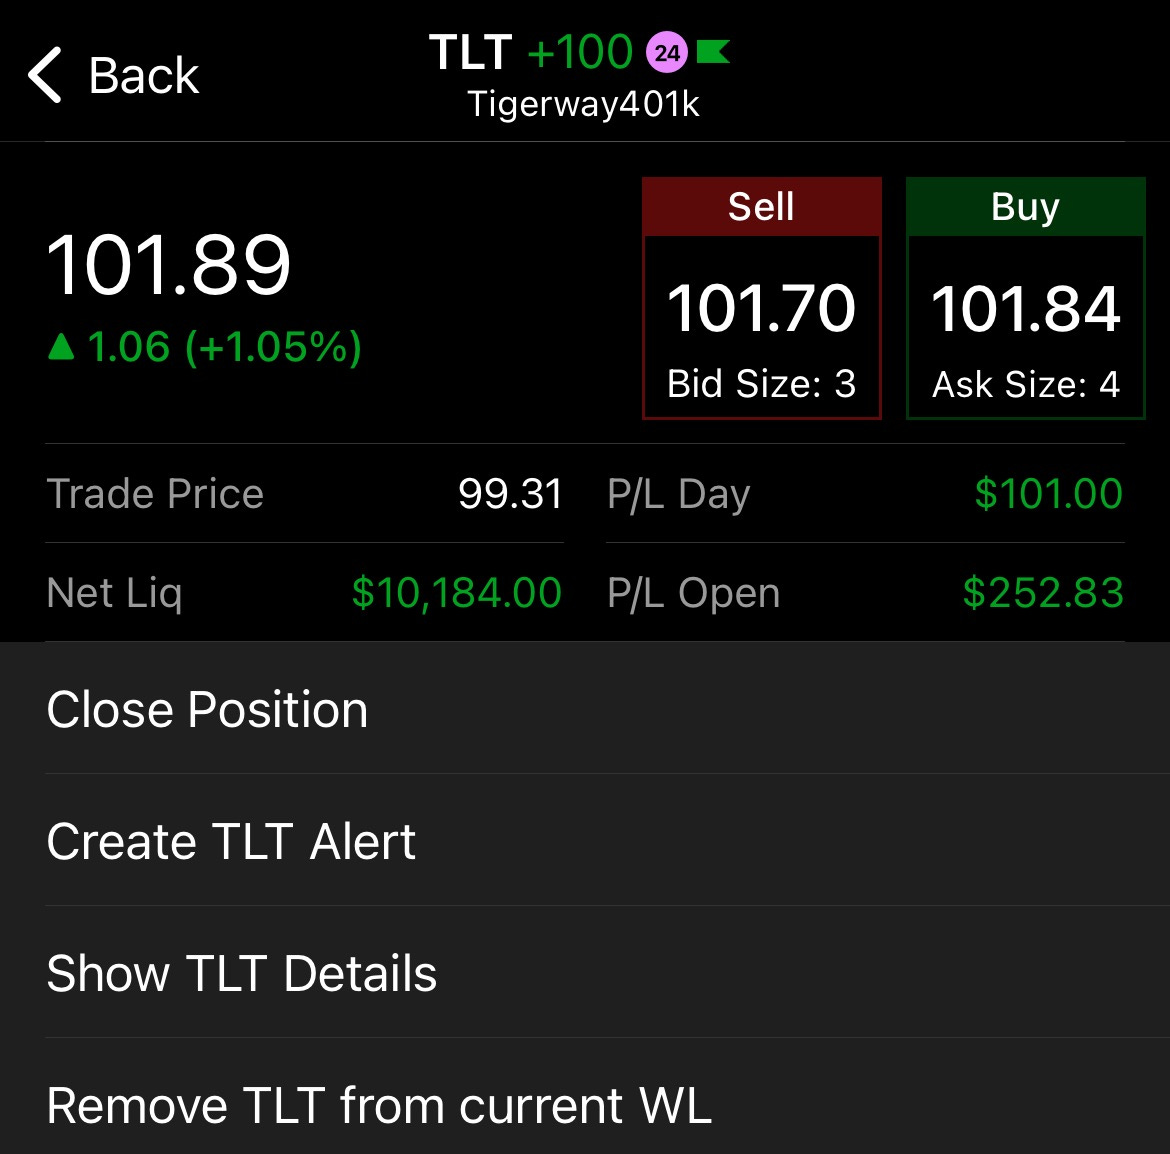
My prior weekend note to members highlighted the importance of Yellen’s trip if one is a trader/investor in Treasuries and the TLT ETF. Given that China and Japan owns a significant portion of U.S. Treasuries outstanding, an improved U.S. and China relationship could stem the selling of treasuries in the near-term.
Coupled this positive geopolitical outcome along with an in-line inflation report, TLT found its footing at 99 per share - a Level that I had provided to members in the Weekly Dashboard in early July.
I was hoping to see 95/share given that I like precision entries (and maybe it will come/maybe it won’t), but I jumped on the opportunity at 99/share for at least a conservative first tranche entry since I saw a recovery in motion.
This week’s narrative was controlled by the 3% inflation figure and the disinflation narrative, but I personally believe what gave the broad market legs for its advance was stronger commitment from China to step up their policy support for real estate and consumer activity.
My research estimates that China accounts for 1/3 of Global GDP, and stimulus from China has positive and enduring effects on global markets as a strong Chinese consumer has constructive implications for U.S. Retail and European Retail names.
Recall that while inflation may have slowed down to 3% headline CPI year-over-year, prices are still structurally higher than they were one year ago. Consumers are worse off, and companies have been reducing capital expenditures in their 2023-2024 forecasts.
Had China not provided further updates on its commitment to bolster the economy and Yellen not had a constructive meeting to stem the slide in U.S. Treasuries (and thereby U.S. Bond portfolios), I do not believe that the inflation report was powerful enough to spark a sustainable advance the markets by 2-2.5%.
Given that the 60/40 Stock/Bond Portfolio concept is a Strategy that is employed by many big time Fund Managers, persistent selling of Bonds & Treasuries (aka higher yields) is detrimental to equities as Fund Managers will have to rebalance the 60/40 allocation.
Given the rate that inflation is moving, the risk to markets is two possibilities:
The markets may start thinking about the concept of Deflation in the coming 3-6 months
OR the equity market rally and housing rebound puts a stop to falling inflation and it actually ticks back up higher.
Neither scenarios are healthy for the market, and with the market being priced for perfection, it only takes a small hiccup to spark a sudden 5-7% dip.
After the inflation report, another constructive narrative appeared - the weakening U.S. Dollar as a result of traders forecasting the end of rate increases soon. The Dollar index broke the key 100 level, and that most likely triggered reactive positioning across asset classes.
The tech sector generates about 40% of global revenues overseas, so a weaker U.S. dollar (to a certain extent) is constructive for tech names with international business exposure.
With positive catalysts and narratives getting released day after day, it’s easy to lose sight of the objective technical picture.
So that is the purpose of this week’s weekly letter - to provide a technical analysis update on key markets and themes to keep our psychology (and therefore expectations) in check.
Each week throughout the month (I send premium analysis on the Weekends), I rotate among Macro, Technical, Fundamental, and DCF company conclusions for my readers.
Last week was Macro, and this week is Technical Analysis (TA). I will cover:
Clean, simple TA on key U.S. Markets
U.S. stocks I’m watching for future upside
Clean, simple TA on key China markets
China stocks I’m watching for future upside
The rally will only end when Retail/Institutional players stop shorting the market. I do not know when the Bears will fully capitulate, but when they do, Bulls should know that one major source of buying pressure will be absent.
In other words, there is a lot of air beneath us.
Let’s talk technical strategy below. My approach is extraordinarily simple. But simple is powerful, and makes the decision making process much faster.
U.S. Markets Technical Analysis
Conclusions for Near-Term Positioning at the index level:
From a technical standpoint, stay invested in the market but raise stop-loss levels and tighten them as an increasing velocity of gains can not be sustained indefinitely.
I do not currently see anything in terms of bearish technical developments besides the market being overbought at the index level.
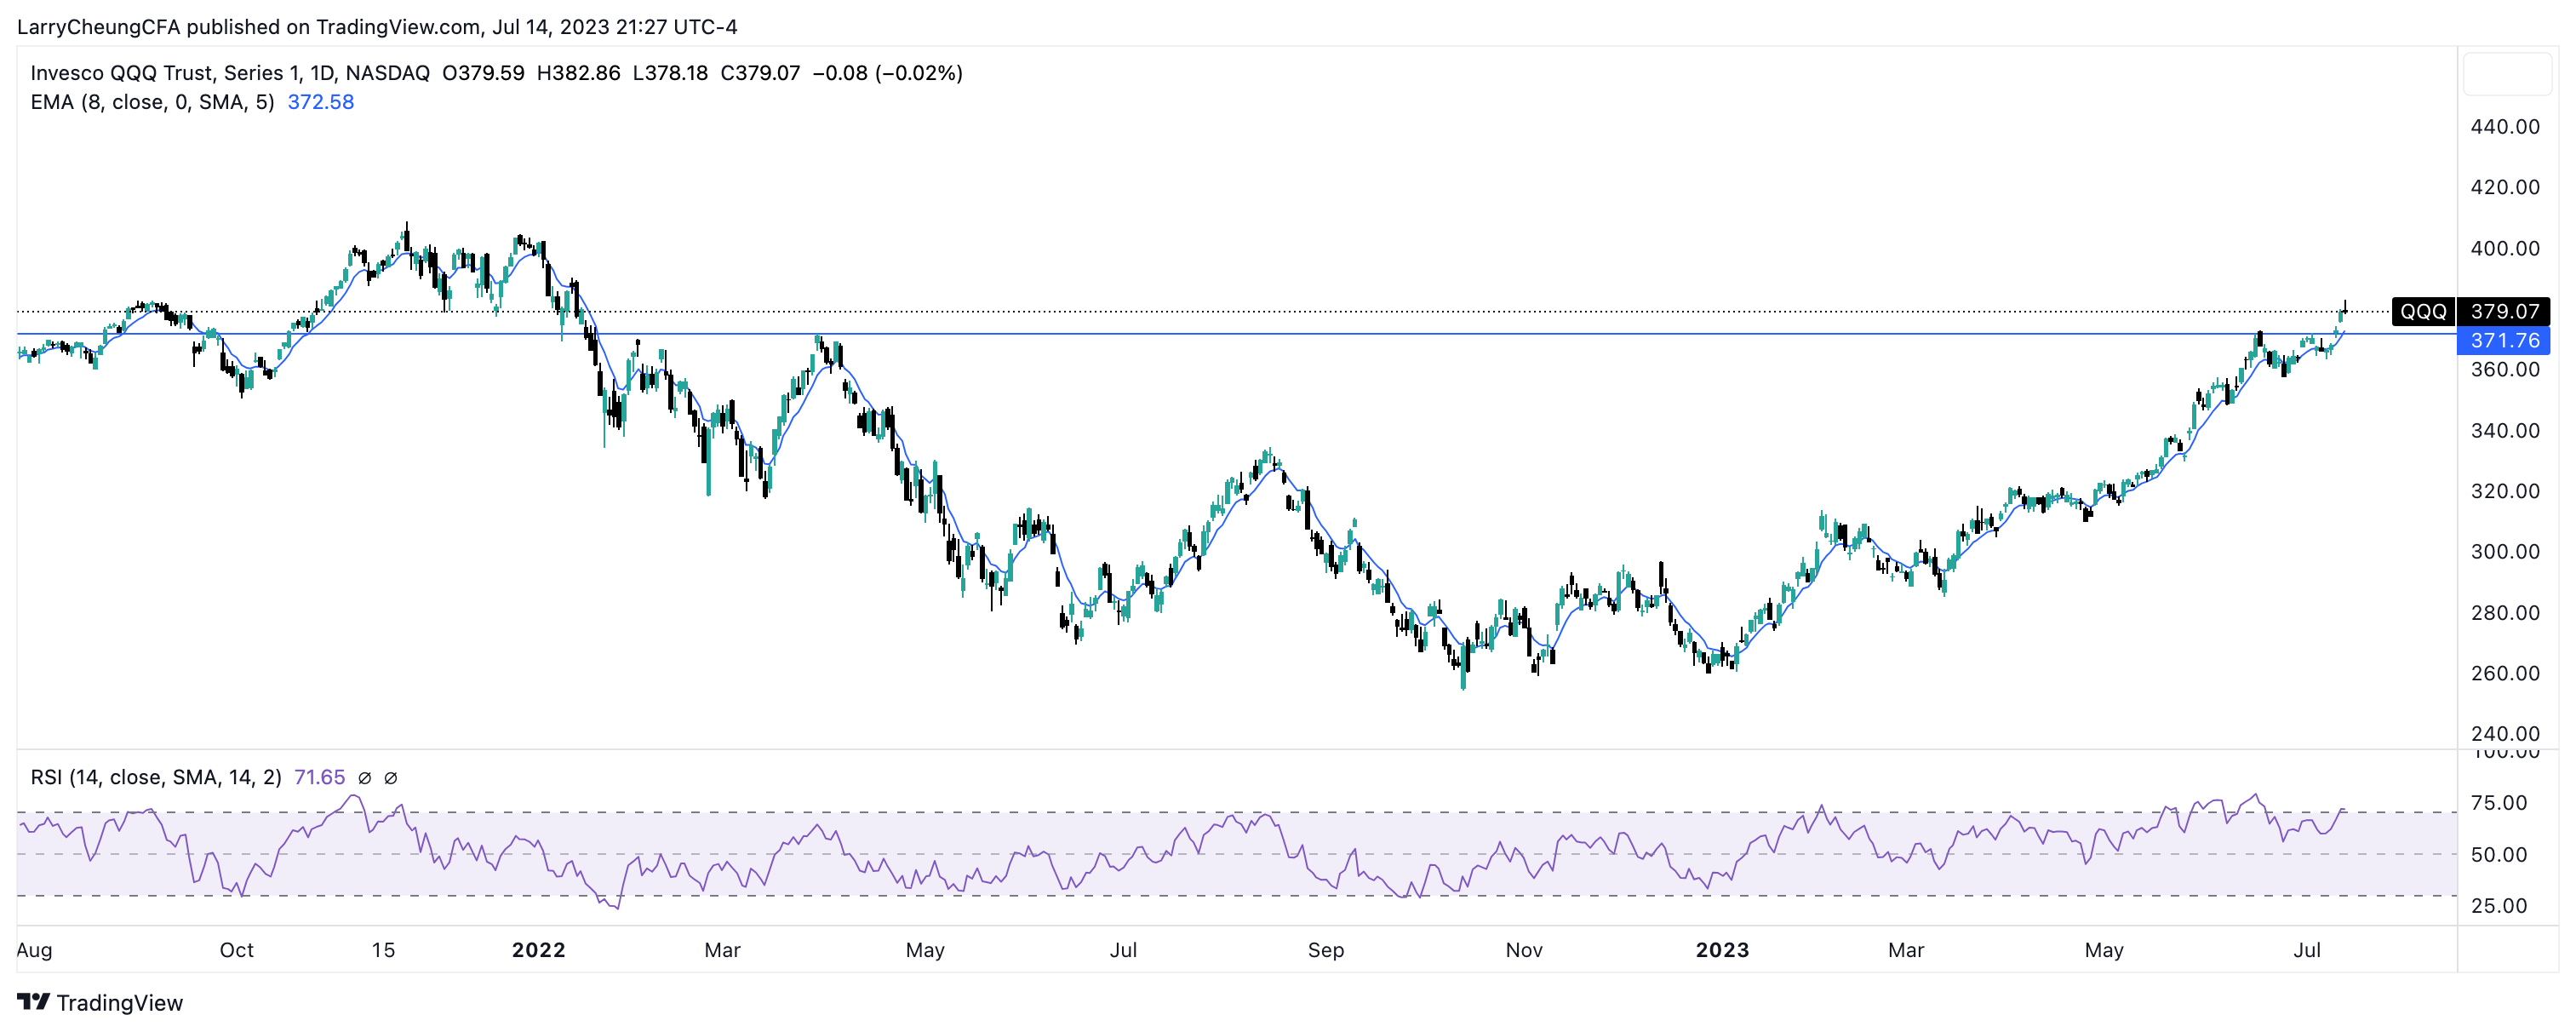
Watch the 8 Day EMA on any pullback on both SPY and QQQ as the broad market macro signals for stock-specific considerations. As long as we are above these levels below, the trend is objectively higher.
On SPY Daily Chart: 443 Key Level
On QQQ Daily Chart: 371-372 Key Level
The technical trend is unbelievably strong, but here’s a unique conclusion I have that I haven’t seen others make: once this market tops out as a Recession appears, this may be the top for quite a long time. In other words, do not overstay this rally once it ends. Good news is that we are OK for now.
The best way at the moment to express a bearish view is to be on the sidelines and hold cash. I think it’s too early to make bets against the market.
SPY (S&P 500 ETF) Technical Setup

QQQ (Nasdaq 100 ETF) Technical Setup
A note on 2023’s unbelievable bull market rally and personal performance management.
Let’s take a step back and imagine the various scenarios that many different market participants are in relative to the index.
Active Traders/Investors within the market this year (or in any year) could experience the following at an aggregate portfolio level:
Down 20% or more
Down 10-20%
Down 1-10%
Flat
Up 1-10%
Up 10-20%
Up 20% or more
With 1H 2023 over and 2H 2023 in motion, the S&P 500 is up an (unbelievable) 17%. This means that most market participants who are not directly in SPY may experience variance from the index.
Here’s how I think about these camps, and how market makers may be overseeing the players from a 10,000 foot view:
The folks who are up significantly have strong hands, and have the most flexibility in what they wish to do. They can call it a day, or they can take on a bit more risk. For me personally, I’m actively methodically de-risking and positioning my exposure to have more cash and less stock exposure. My personal goal as shared publicly before is to target about 1% a month on average, for about a 10-12% year. Because I’m above this target, my focus now is squarely on capital preservation. Anything above this target range is a blessing for me from my perspective. My current focus is not to capture as much upside as possible but to truncate the downside potential.
The folks who are flat(ish) most likely feel a bit of FOMO. They may be looking at the high-growth stocks or the Semis space to see what other plays still have room for NVDA/TSLA-like growth. This group may be inclined to take on more risk relative to their tolerance to play catch up. This group most likely has a higher cost basis as a cohort and are the first to sell upon a correction to mitigate losses.
Folks who are down significantly may feel like they have to double down on risk on either the long or short side to close the gap with the S&P 500. This group of investors make take on positions that are incompatible with their best interests from a long-term standpoint. It may be wise to wait for a sizable correction, and then enter the market to chip away at losses. Numerous Studies have shown that people try to take bigger risks to quickly make back losses - when in fact, the better (albeit more mentally challenging) way to recover is to claw back losses piece by piece, step by step. Statistically speaking, I believe it is better to be more conservative when the account is in drawdown. It allows you to rationally plan out a path to recovery. Once you have house money to play with, then you have more leeway.
I share these comments above because I would like to see my Community members succeed and would like to share perspectives from how Institutional Investors play chess with Retail investors in the market.
Please note though, my comments above isn’t directly financial advice but rather my thinking on the matter. I cannot answer individual questions about individual positioning/transactions.
Are there any promising names left in the U.S. market on the Long side?
Now, besides the broader index, the following names have solid long-term business models in today’s macro context and are candidates to watch on dips. They are both tactical and long-term candidates.
Recall that my philosophy in a bubble market, which is what I believe we are in, is that our one and only goal is to capture a piece of the action. If we enter the position with the expectation that we will capture the very last tick of the top, I can say with certainty that we will end up selling far beneath our entry point.
Here are some Stocks I’m watching and technical/valuation context (these names are outside of my Dashboard because most of the names in my dashboard are far too overbought to guide upon):
You’ll notice that none of these names are tech oriented. I think tech has run up too far, and even if there is upside remaining, the reversal will be sharp, sudden, and large.
Continuation Ideas for the coming weeks & months on my watchlist
Ferrari (RACE): I’m watching for either continuation higher or a bounce from 321/share. In terms of growth names that are resilient to recessions, RACE fits the bill upon pullbacks.
Johnson & Johnson: 159 looks to be a key level, which if supported, could see JNJ rebound back to 163+. Health-care always does better in a recession (see that traders will not United Health UNH decline past a certain point without a large rally)
Costco could see 550-560 or better by year end if consumer confidence is stable
TJX: Any pullback to 82-83 could be a healthy recharge for a move back to 86 or higher. Within retail, the trend is towards smart consumer spending and TJX is a magnet for deal hunters.
Walmart: Defending 154 on WMT may have the name retest 158 in the coming 6-8 weeks.
Members know that I also like Dollar Tree, FIVE, and Dollar General which I’ve discussed multiple times. They’ve recently made large bounces, so we have to lengthen the timeframe for further upside.
It goes without saying that I am most eager for a correction in the market so that I can have more names to share with the folks.
The list above has been carefully considered to Hold if necessary as these names will stand the test of time for long-term investing.
These names are safer, not as sexy as FAAMG & Semis, but will not cause portfolio havoc when the pullback comes. And at the same time, I see them still having upside.
China Technical Analysis
*You can find macro analysis on China in previous reports. This note is largely a technical briefing.
Conclusions for Near-Term Positioning:
China recently underwent another multi-week rally which took the sector up about 12-18%.
The start of the move was on July 6th and we are in the July 14th-16th weekend. 10 calendar days have passed, and my observation is that good times last in China stocks around 7-17 calendar days. Average sector bounces is in the ~15% neighborhood. This suggests that Traders have entered a period where near term upside is still available but has been consumed, and therefore, will be more contested.
Looking out longer-term, if we truly are behind the harshest days of regulation, I am inclined to move my upside targets higher as that will be a direct help to names in China.
At this juncture across China internet, I move my stance from a Tactical Buy to a Hold.
KWEB ETF (China Internet) Technical Setup

Names in China that have intermediate-term catalysts in narratives
If China ends up stimulating the real-estate sector, the clearest beneficiary from the KWEB ETF would be Beike Holdings (KE) - sometimes known as the Zillow of China.
Beike is extraordinarily volatile and is better suited for investors who are comfortable with massive swings. +/- 5-10% days are very common on this name.
My view on Beike is that if it holds 13.5-14, it may eventually make a run back to 17. Now 15 and change.
A violation of 13.5 and I suspect speculators may target downside to the 12 region.
Another name that I’m watching is New Oriental (EDU) - if we zoom out, we can observe two things: the first is that there has been a large range between 36 and 44 from which most of the activity has taken place and second is that the stock has tested the 44-46 region 4 times in the past several months. And we hovering at this area now.
If the 42 neckline level finds acceptance during a moment of more welcoming China macro sentiment, I think the 46 level will eventually be broken and EDU can see 50+.
EDU is coming off a rolling over price pattern & RSI. I like the name, but need to see price action invalidate the roll-over technical patterns.

Last thing I’ll say is that among the ECOM names of China where most folks follow Alibaba closely, I would also think that Pinduoduo (PDD) is one of the biggest beneficiaries of an improving U.S. & China relationship. The latest trade disputes on Pinduoduo has been a drag on sentiment.
Their TEMU marketplace is extremely successful in the U.S. (in my view), and their growth rates are much larger than Alibaba and JD’s. The offset is that their capital expenditure is very large - and this means that a slight shift in gross merchandise value (GMV) could swing their EBITDA/Operating profit severely quarter to quarter.
This explains the massive volatility that PDD often sees.
Long-time members from earlier this Spring may recall that I’ve liked PDD in the 60s region. This name routinely makes moves of 15-20% (up or down) in 4-6 week timeframes.
PDD just recently made a rapid multi-week upswing back to 80 from 67. On longer timeframes (looking out 6-9 months), I see that any successful defense of the 72 level may position PDD back to 90-100 (or better).

Much more to come folks - there’s much more to come.
I have a lot in store for the Community.
Stay tuned.
Weekly Dashboard attached below will be updated by Sunday evening. Check for the new file then.
~Larry