Hi Everyone,
In this note, we’ll go through the DCF Conclusion Study for Broadcom (AVGO). This is one of the central companies that represents the infrastructure play behind the A.I. movement.
A few weeks ago, it was my opinion that Broadcom was carving out a swing low in the high 1200s area and I shared this with the members. As of this post, Broadcom is in the mid 1400 region.
Now the reason I am more focused on DCF Conclusion Studies on the top weighted companies within QQQ ETF is that I believe this is an extremely practical and powerful approach to understanding how much further QQQ ETF (and also its SPY ETF peer) can go after reaching 2024 all time highs again.
When you know what is a realistic trading range for the most important stocks inside the index, you have an edge in really understanding the index itself.
After Broadcom’s DCF Study is published here, I will have completed a DCF Conclusion Study on the top 10 names within QQQ ETF (NQ Equivalent) to produce Bull (upside) and Bear (downside) cases.
The DCF conclusions on fair value for the top 10 names are very helpful in guiding me for both Intraday Scalping and Long term investing purposes (I trade NQ Intraday, and I hold QQQ ETF in my 401K).
The table of companies below contributes almost 40-45% of QQQ’s weight. Our edge in understanding tech increases when we know the fair value of these companies.
Broadcom’s contribution to QQQ (and therefore NQ) is 4.5%.
Let’s get into it!
Most Important Companies within QQQ ETF (and therefore, NQ)
Broadcom DCF Discussion/Context
As will be shown below, Broadcom’s suite of infrastructure products to aid the AI movement has resulted in substantial revenue and EBITDA estimate upgrades since 2023.
Broadcom has a much lower profile in terms of press coverage when compared to NVDA or AMD, but in my opinion, it is one of the most important companies within Semiconductors to follow given its positioning in the Semis ecosystem. At certain points throughout the past several years, Broadcom would often be the #1 stock inside the SOXX ETF, in terms of weight.
Even though the company has moved higher significantly over the past 12 months, this is one of those stocks that has a long runway of upside ahead (especially if one has a long term time horizon).
Exhibit 1: DCF Core Figures from 2023
Exhibit 1: DCF Core Figures from 2024
Here are the conclusions that I’m drawing (Please look at comparable years when looking at the exhibits above)
Across comparable years 2024-2027 and terminal year 2028, Wall Street has significantly upped the Revenue Estimates for Broadcom by almost 30-40%. This is because of the increased demand for Broadcom’s infrastructure products fueling the AI industry
The Street has also upped EBITDA expectation by 30-40% as Broadcom enhances their margin profile due to higher pricing and disciplined cost management.
As will be shown below, Broadcom does trade at a valuation premium, but because it is participating in an end-market with a large Total Addressable Market (TAM), the company positions itself for large contractual revenue wins if there is a technological need in the marketplace which the firm can develop a solution for. This explains the large increases in Revenue and EBITDA estimates from 2023’s model and 2024’s model. Such business model enhancements are only usually possible within the tech sector.
Margin Commentary (Margins are incredibly important to the DCF Model):
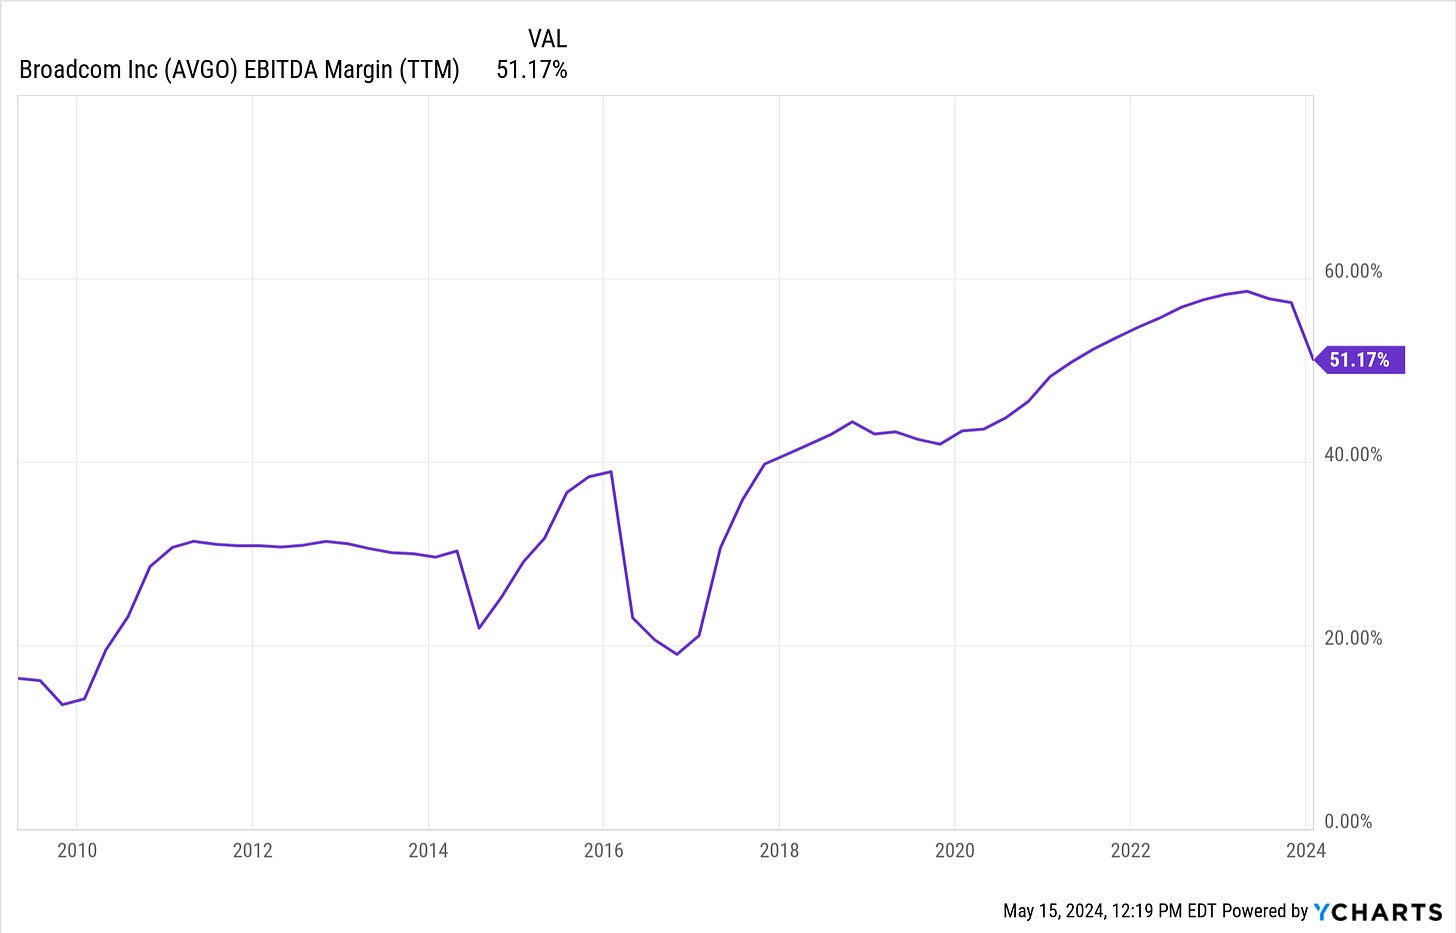
We can see in the chart below that Broadcom’s margins and profitability profile are drifting towards the high end of its corporate history.
Tech companies within the AI industry tend to have above-average margins because the specialized Chips they sell to CapEx clients such as Meta, Google, and Microsoft and they tend to have higher average selling prices (ASPs) due to their custom nature.
The Street is looking to see Broadcom’s EBITDA margins drift towards 65% in the coming 2-3 years but I view that as ambitious.
My model suggests that Broadcom does not need a 65% EBITDA margin to see significant share price appreciation, and in fact, even a 55-60% margin profile is enough for the company to see upside.
If 65% were to actually be reached, Broadcom is a 50%+ Stock Idea for a 2-3 year hold.
Valuation
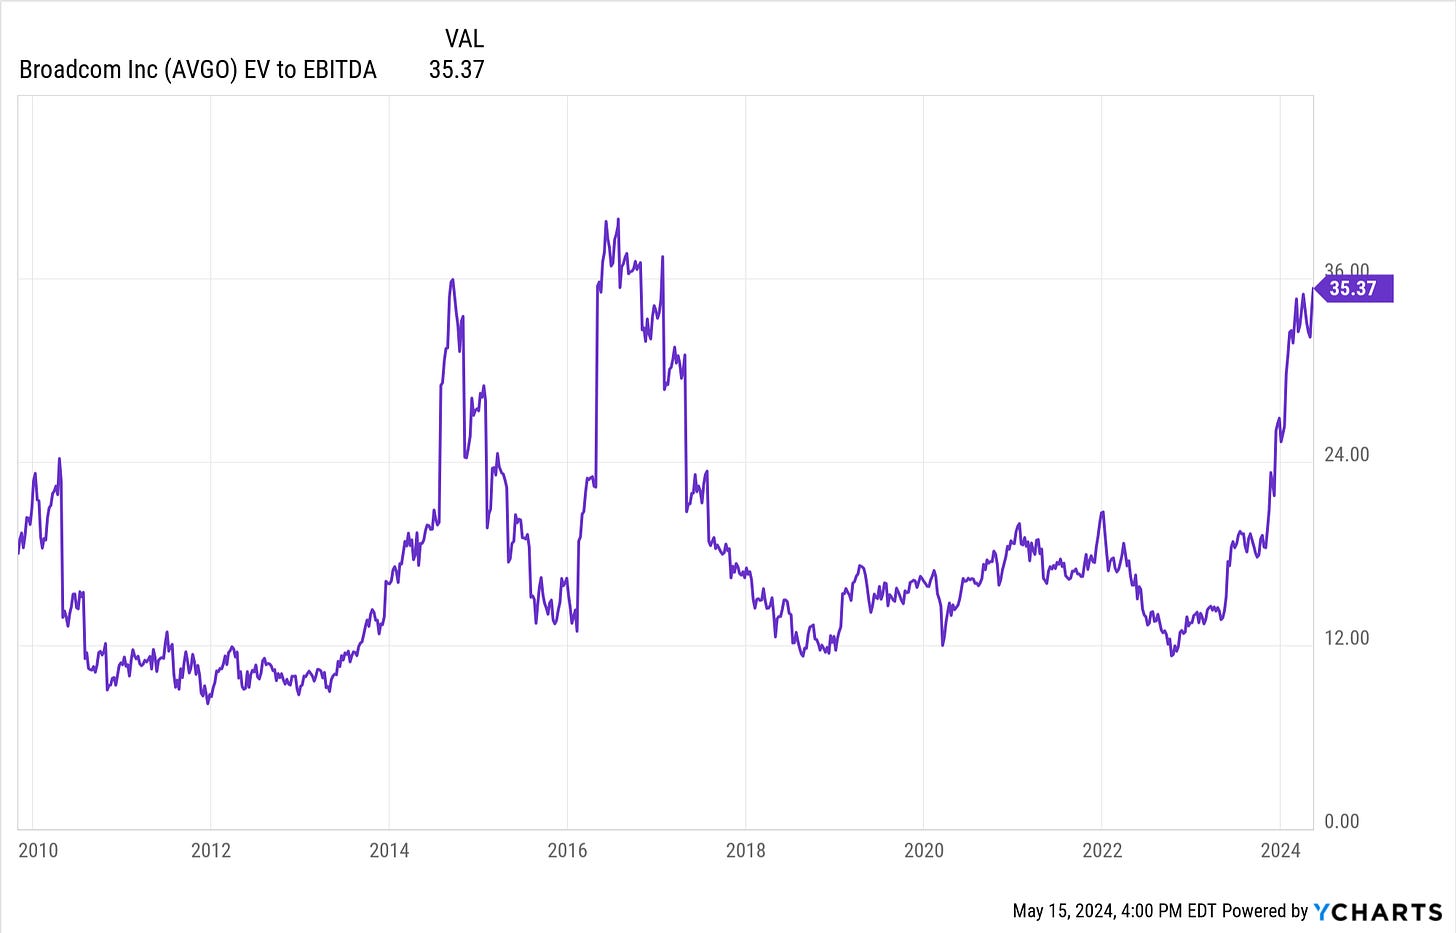
Previously priced at 18X EV/EBITDA in 2023 when I had last updated my long-term model, Broadcom’s valuation has doubled to 35X and is now nearing its historical corporate high for valuation.
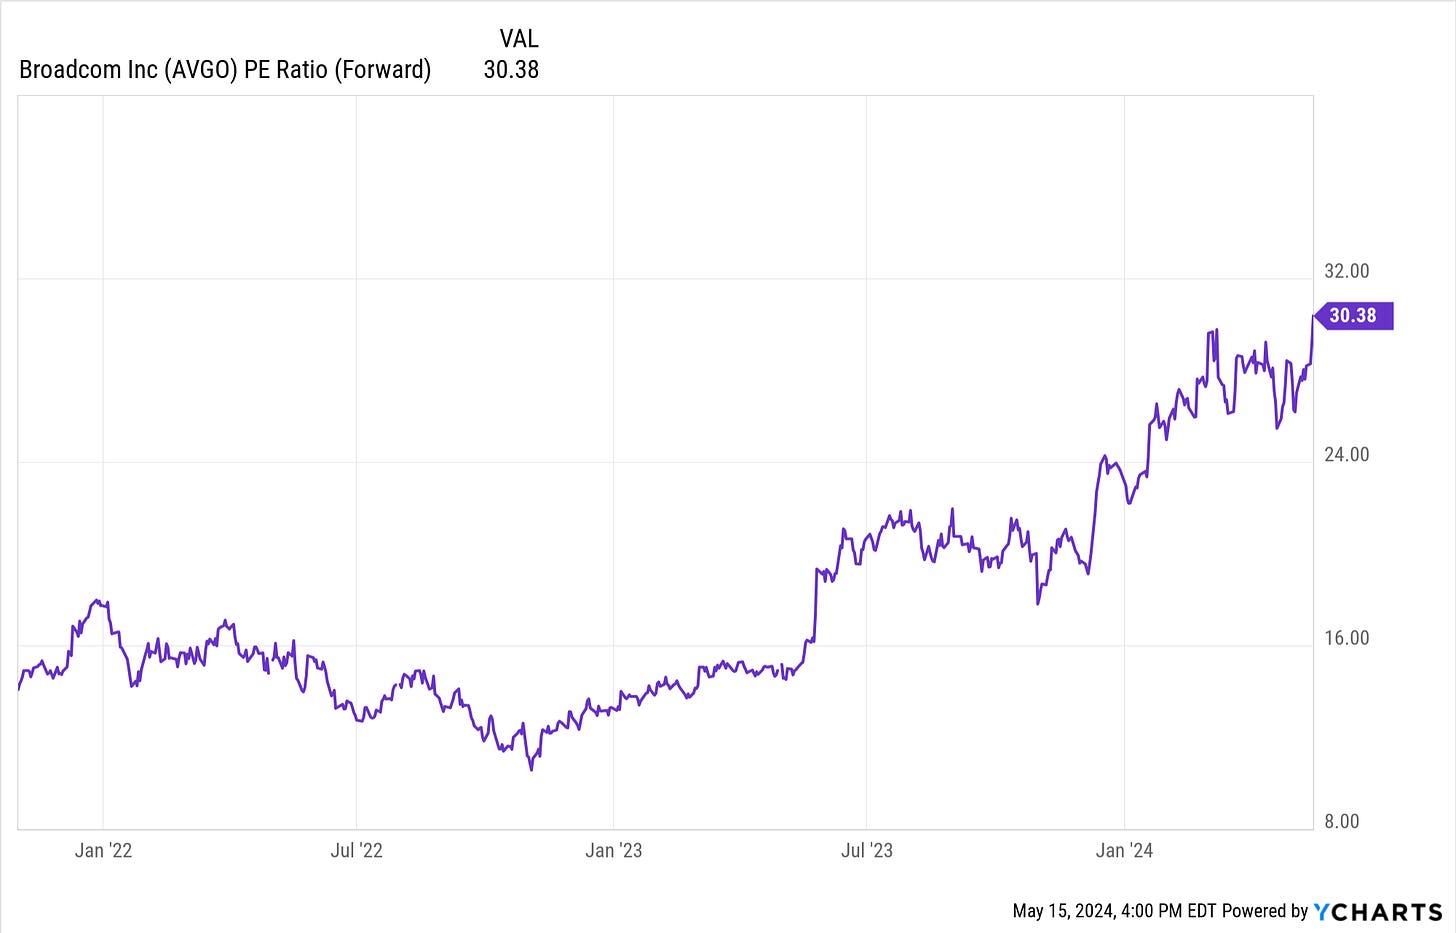
As investors get more excited about increasing profitability, they have also bid up Broadcom’s Forward P/E to above 30, which is also a historical corporate high for the company.
Notice that AVGO sees large up-cycles and downcycles in its EV/EBITDA valuation chart below - this is because sentiment around the underpinning success of the company’s products are being closely scrutinized every 1-3 quarters.
It is for this reason (the higher Discount Rate due to risk) that Broadcom trades more volatile than Costco AND has a cheaper valuation than Costco even though it is an AI stock.
Within the AI space, I think Broadcom is best in class and at its price, far better than Apple - which also trades at 30X Forward P/E.
If you’re going to pay 30X forward earnings, Broadcom offers far more upside potential compared to Apple. Far more.
Risk obviously is higher in Broadcom, but this is compensated for in terms of upside potential which I’ll discuss below.
Exhibit 1: EV/EBITDA
Exhibit 2: Forward P/E
DCF Model Outcomes/Scenario Analysis:
The most important inputs in my opinion are 1.) Top Line Growth (Sales) 2.) EBITDA Margins (profitability) and 3.) Valuation Multiple EV/EBITDA (what Investors Pay).
In all scenarios below, I will assume Wall Street Revenue estimates are accurate. The inputs that I change are EBITDA Margins and the EV/EBITDA Multiple. Changing revenue estimates do not move the needle by that much.
Scenario 1 Assumptions:
Wall Street Revenue Estimates are accurate
Terminal Year EBITDA margins are 45% (BELOW today’s mid 50% margin level)
Apply a 30X EV/EBITDA multiple (BELOW the 35X EV/EBITDA Multiple today)
1725-1750/Share
Scenario 2 Assumptions:
Wall Street Revenue Estimates are accurate
Terminal year EBITDA Margins are 40% (20% BELOW today’s mid 50% level and FAR off the Street’s 65% terminal expectation)
Apply same 30X EV/EBITDA multiple (BELOW the 35X EV/EBITDA Multiple today)
1570-1585/Share
Scenario 3 Assumptions
Wall Street Revenue Estimates are accurate
Terminal Year EBITDA Margins are 35% (Bringing it back to historical Average of 35%)
Apply 25X EV/EBITDA multiple (30% Off Today’s multiple)
1195-1205/Share
Scenario 4 Assumptions (Mega Bear Case)
Wall Street Revenue Estimates are accurate
Terminal Year EBITDA Margins are 20% (Cut margins by 60%!)
Apply 17X EV/EBITDA multiple (50% Off Today’s multiple)
560-575/Share
Note: Unless the market crashes, this is quite unlikely. If this price were to offer, I’d say buy as much as you possibly can and hold on forever.
Commentary:
As can be seen above, even after cutting terminal (final year) margin estimates and lowering the valuation multiple, Broadcom still offers upside that is relatively meaningful (especially when considering that U.S. indices are at all time highs and most companies are stretched in terms of upside potential).
I used conservative assumptions and inputs above. Had I used more aggressive inputs such as 55% EBITDA Margin profile or even keeping the 35X EV/EBITDA multiple constant, Broadcom’s fair value drifts north of 2000+/share in the coming 12-18 months.
Within NQ (and QQQ ETF respectively), I think Broadcom is one of the Best Dip Buying ideas when a corrective cycle comes.
I discussed it and shared it with the Community in the mid 1200s. Now it’s in the mid 1400s. There’s more upside from here on longer term horizons.
A good area to add more if offered is the 1150-1200 region.
Bottom Line: I actually don’t think it matters what type of drawdown AVGO goes through from here until 2025-2026, I think Broadcom ultimately gets to 1700-2000/share within 18 months. That means the key then is to buy at lowest prices possible to maximize ROI.
-Larry
Link to DCF Archive: https://larrycheung.substack.com/t/dcf-modeling-fundamental-analysis
Link to Educational Guides: https://larrycheung.substack.com/t/educational-guides
Q&A: Why I focus on NQ as a primary market.
My focus: I now focus about 95% of my attention on price action when it comes to the indices. I would strongly encourage spending lots of “screen time” for folks who want to navigate the market.
Note: I publish Monday-Thursday. These are my opinions based on my own research and my model may or may not aligned to the market’s thinking. I have to repeat this in all my notes as there is an element of the unknown in today’s strange macro environment.
Disclaimer: My investment community is not investment, financial, or trading advice, but for educational informational purposes only. I am happy to share my personal opinions which I provide as my personal journal. Trading of any kind of securities involves a lot of risk. No guarantee of any profit whatsoever is made. Investors may lose everything they have. Practice extreme caution. No profit is guaranteed whatsoever, You assume the entire cost and risk of any trading or investing activities you choose to undertake. You are solely responsible for making your own investment decisions. Owners/authors of this publication are NOT registered as securities broker-dealers or investment advisors either with the U.S. SEC, CFTC or with any other securities/regulatory authority. Make sure to consult with a registered investment advisor, broker-dealer, and/or financial advisor.


