8 Important Charts to Consider for your 2023 Investment Plan
8 Charts That Matter both in the near term and long-term for U.S. and China equity portfolios
Note: Ahead of next week’s critical inflation data (the last one of 2022) to be released on December 13th, I’m going to be sharing 8 charts that I’m personally watching for this upcoming event and the weeks heading into 2023. These charts have near-term and long-term implications for markets and your portfolios.
This email is made public to all out of service to the Community at large. For deeper context into what these charts will mean for S&P 500 and China key levels to add/reduce risk, we discuss the specifics of that in our Community. Here, I will share the charts for your reference and personal benefit. Inside our Community, I will tell the good folks what I plan to do with them based on my assessment.
This is an email post designed to push your intellectual thinking. I want to see you all become self-sufficient fisherman in markets. The Investment Community that I have created so far (and all the powerful actionable and accurate research that has come to fruition) has completed Stage 1 of its development. Stage 1 has been incredibly successful and I plan to keep positively impacting as many Retail Investors as possible.
Stage 2 (new offers, new programs, new strategies, new expertise by me) is coming sometime in Q1-Q2 2023. Stage 2 is not suitable for all investors. It involves Options. More on this in the future.
Please make sure to follow me on Instagram and Twitter for frequent updated commentary. As always, thank you to Interactive Brokers for being a partner of our Channel and putting a stamp of approval on our Research insights.
8 Charts that I’m hyper focused on as we start planning for 2023
Chart 1: The Fed’s Balance Sheet
Questions & implications to explore (not exhaustive):
What will the impact of Fed QT be on U.S. Markets?
What will the impact of Fed QT be on CHINA markets?
Will the Corporate Buyback spree be enough to counter the liquidity drain of QT?
What will happen to treasury market and MBS (mortgage backed securities) liquidity if QT keeps going?
What is the Fed’s QT impact on the U.S. Dollar and what does it mean for emerging markets that are indebted to the U.S?
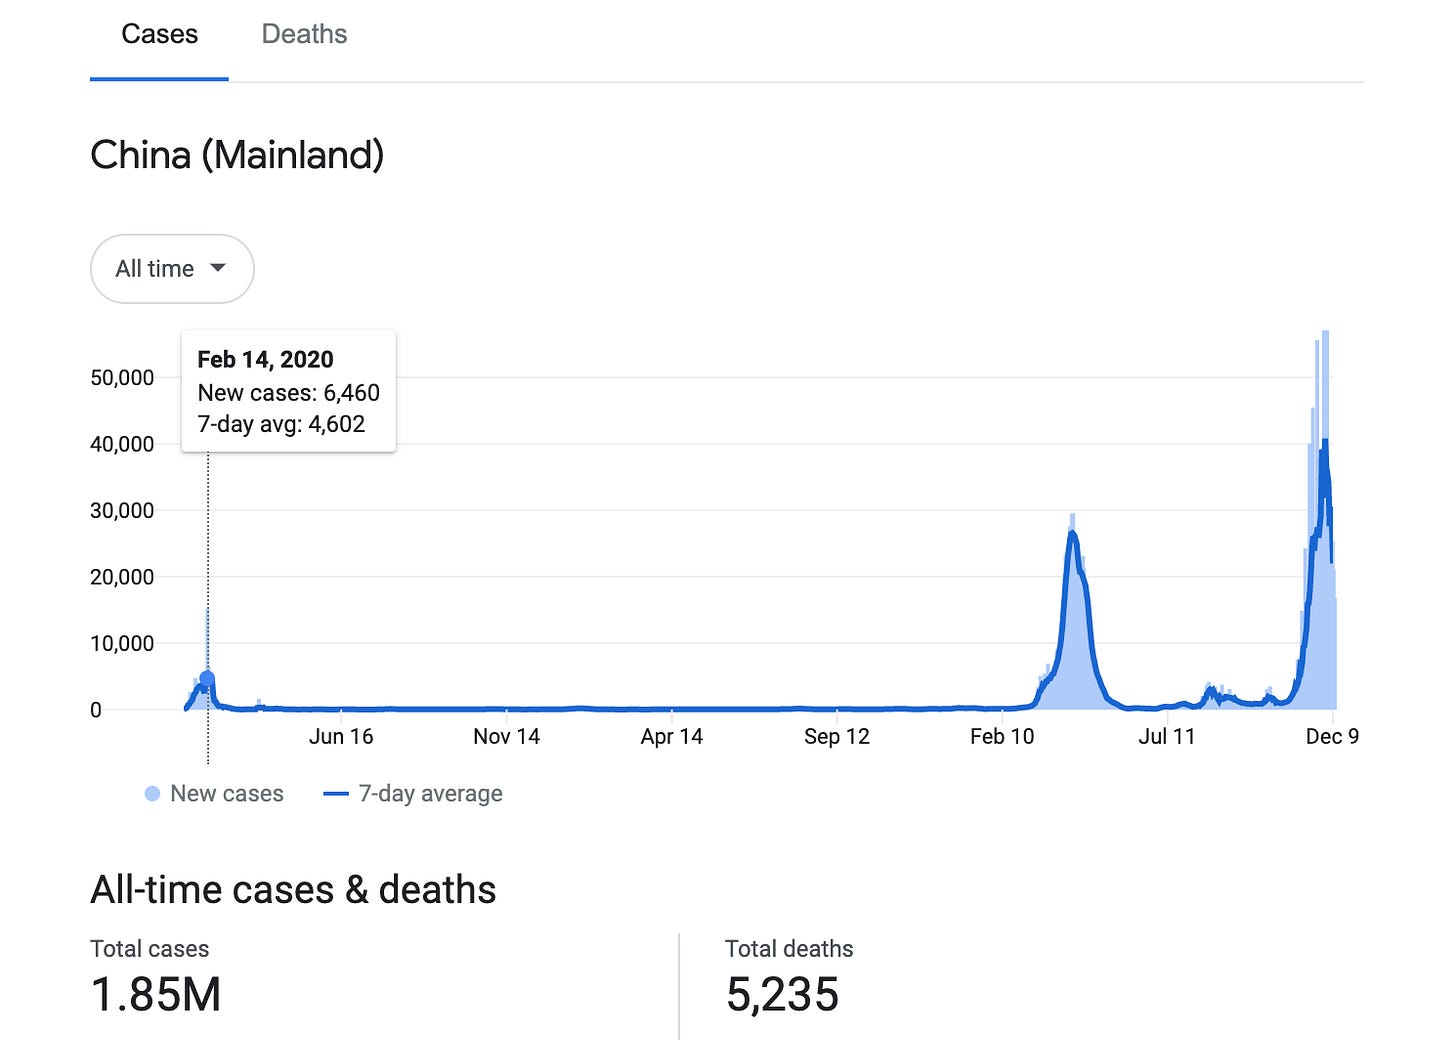
Chart 2: Covid Case Counts in China
Questions & implications to explore (not exhaustive):
Is China’s official reopening really a one-way trade for China stocks? Or is there something lurking in the background that you haven’t thought about?
Have we seen the biggest surge of Covid cases for China yet? Or is the big surge to come?
Why did China’s leadership make rapidly change their tone on Zero Covid? Was it really because of protests? Or something else…?
What is the efficacy rate of the current vaccine? And what is the vaccination rate among the elderly?
What will China’s response be to a large Covid case surge?
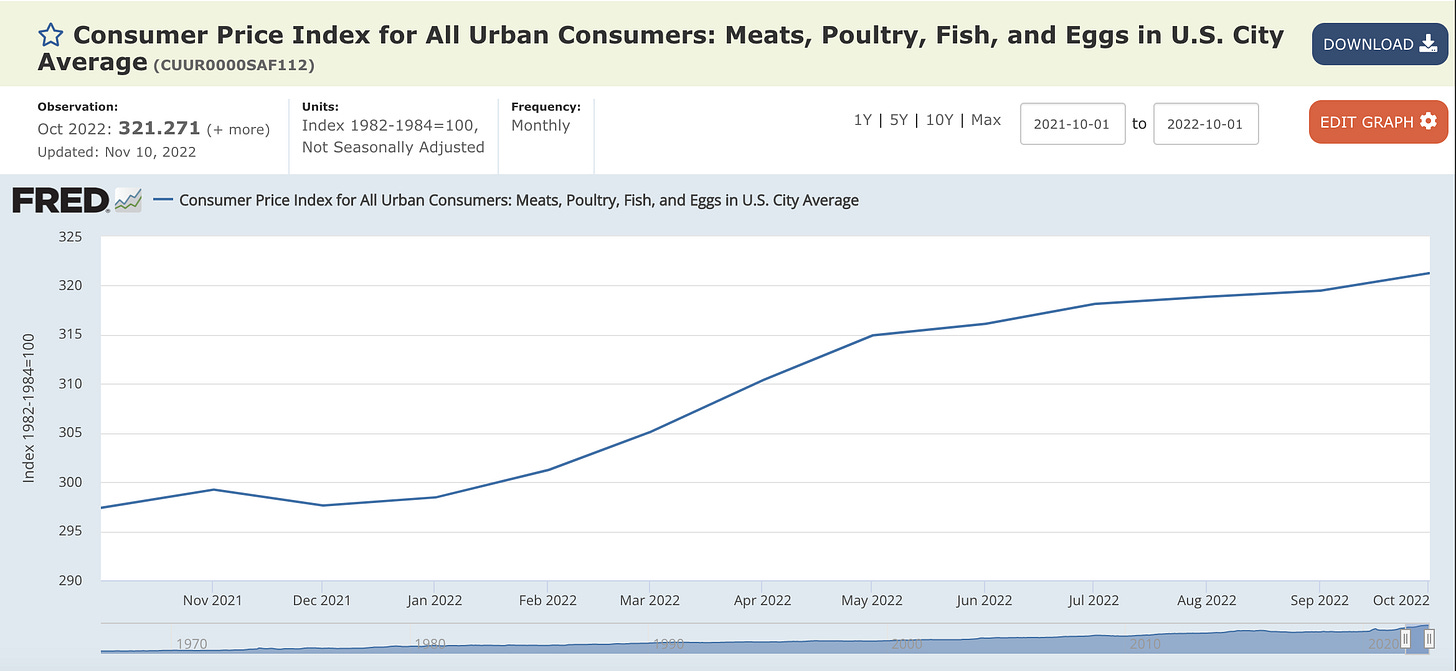
Chart 3: Meats, Poultry, Fish, and Eggs (one of the largest food items within food CPI)
Questions & implications to explore (not exhaustive):
If CPI is going down, but the chart above stays elevated (or gasp, goes higher), is the Consumer going to feel more or less confident?
What are the components required to take the prices of this food group down?
Do you know what % of consumer budgets are now allocated to food from a personal budgeting standpoint?
Do you know how to evaluate the Food CPI line items? Or are you ONLY looking at the headline Food CPI contribution?
Chart 4: The Unemployment Rate
Questions & implications to explore (not exhaustive):
Does the non-farms-payroll (NFP) data tell the true story about jobs created? Do you know how it is calculated?
Where will the 10Y Treasury or S&P 500 trade if unemployment is at 4%, 4.5%, or 5%?
How sensitive is the Fed to unemployment, and where is their backstop in case this figure spikes in the next 6 months?
Chart 5: US Dollar to Chinese Yuan Exchange Rate
Questions & implications to explore (not exhaustive):
What does Xi Jinping’s recent visit to Saudi Arabia mean for the Chinese Yuan compared to the U.S. Dollar in global currency dominance going forward?
How will the U.S. react to Saudi Arabia mulling a decision to (potentially partially) price oil in Chinese Yuan?
What will a stronger Chinese Yuan mean for foreign investment into China’s real estate and equity markets?
Chart 6: Diesel Fuel Prices
Questions & implications to explore (not exhaustive):
What’s the importance of following Diesel, versus say Crude Oil in the real economy?
How does Diesel impact the inflation story? How does Crude Oil impact the inflation story?
What are the driving forces behind Diesel and what could cause it to have further upside or later retrace?
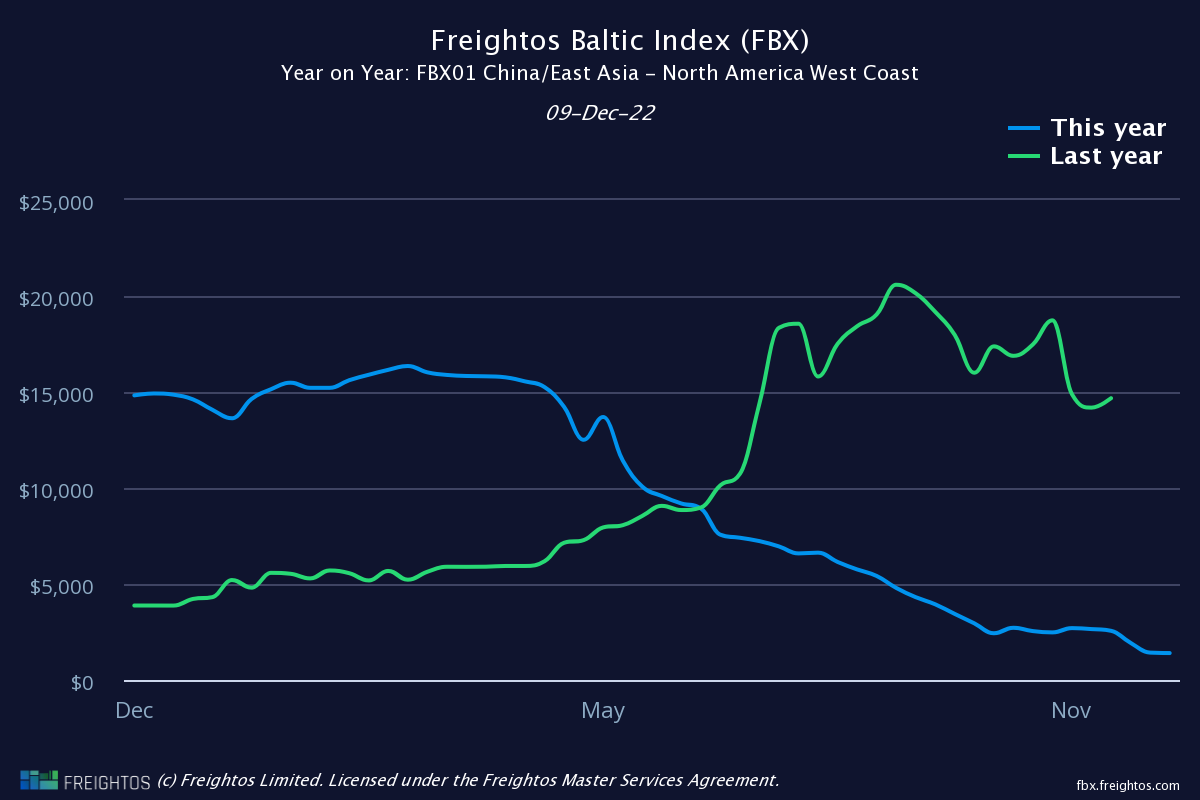
Chart 7: Shipping costs from China/East Asia to North America
Questions & implications to explore (not exhaustive):
What does chart tell you about shipping demand for global trade?
Why are freight prices falling significantly? Is it a harbinger of what is to come?
Is this a sign of healthy falling inflation? Or is this a more insidious sign of inflation’s evil sibling: looming Deflation?
Chart 8: U.S. and China M2 Money Supply
Questions & implications to explore (not exhaustive):
Will China’s M2 Money Supply growth be enough to offset the dampened Consumer Confidence in China’s local economy?
What does the U.S. M2 Money Supply suggest about the state of liquidity? Do you know whether the Fed’s money printing machine is turned on, or is it working in reverse?
What will a combined impact of elevated rates for longer, an ongoing QT operation, and falling M2 U.S. money supply mean for liquidity in markets in 2023?
Final thoughts
I see a lot of folks on Twitter calling for S&P 500 to be 3000-3200 when all is said and done.
If that happens, it’ll be catastrophic for many folks. Many won’t be able to recover from this if they don’t plan properly.
In other words, a generational setback could be coming before the generational buying opportunity.
Seriously, I’d have a plan on what kind of key levels to pay attention to.
In my opinion, there is little reason to hold a significant amount of equity exposure all the way down to 3000-3200. There will be time and key levels to get out of longs (if you haven’t yet already reduced some tranches at 4000-4100 like we did inside our Community on Substack/Patreon).
You may be given another chance to lighten up post December FOMC and November inflation data if it comes in cooler than expected. Maybe. Maybe not.
Will you take it? Or will you stay in the trade hoping for more.
In the event of an obliteration event for Bears, some Bulls will try to catch every last tick up to 4100-4200+.
But ask yourself this: is trying to buy the breakout a wise move?
Fear will kill you in this market. But so will Greed.
We’ll discuss what we’ll be doing (and more) inside our Community.
Reminder: Make sure to follow me on Twitter and Instagram.
Share this email to friends and family - have them join my free list first. I want people to fully understand my research style before joining. Give a like to this email if you enjoyed it.
My Previous emails that may interest you:
What’s the upside on China after the latest rally?
My thoughts on the recent Jobs report (which I thought was nonsense)
Learning from Warren Buffet’s timeless strategies to advance yourself as an Investor


