


DCF Conclusion Study on Apple (AAPL)
AAPL DCF Conclusions Shared
Hi Everyone -
This has been a very productive few days as I have completed DCF Conclusions on NVDA, MSFT, and Amazon, which have allowed me and Members a deeper glimpse into how the Mag7 is being valued. Members can find the DCF Archive here. Some of these notes sometimes are sent out in the evening because DCFs are very time intensive to do, so thank you for your patience.
I continue to believe the best fundamental way to assess the S&P 500 and Nasdaq-100 is to know What is the Fair Value of every single Mag7 along with key Semiconductor companies.
By knowing where their fair value is, we will better know if Support 17XXX for Nasdaq-100 will hold or if it will fold. Same thinking goes for ES (S&P 500 Proxy).
How so? For instance, if every single Mag7 is only 10% overvalued from a stress-tested scenario, then a 10% correction in NQ (Nasdaq-100) is a trading entry point and NOT an area to begin an entry to short-sell into. Vice-versa is true if undervalued.
Today’s note will be focused on Apple, the 2nd most important stock in the market.
Before we get into Apple, I posted another trade recap on Instagram for today’s action, where we had a gap-down scenario at the open which later recovered by mid-day. Our key level was to focus on 5060 not being breached on ES (S&P 500 Proxy).
My goal on Gap-Down Days is to find Low of Day or Local Low and per our pre-market plan I sold 0DTE ES Puts 20 points below ES after it became clear to me that 5060 from the plan may be defended. I was fortunately able to capture about 40-50% of the premium evaporation.
Once again, Traders who sold 0DTE puts < 5060 saw full premium collection. To mitigate risk, I am usually quite happy with 50% premium evaporation if achieved within 2 hours. Otherwise, I’d have to wait another 4 hours to see the rest of the premium burn towards 0.
Let’s now talk about Apple’s DCF conclusions.
As we have completed NVDA, MSFT, AMZN, and AAPL’s DCF conclusions, I believe we will have a slight edge when understanding intraday and intermediate context.
DCF Values and Conclusions are in fact responsible for some of the “Support & Resistance” levels that retail folks look at on a chart.
But without a DCF, they will only understand it as “Support” and “Resistance” without further context.
Is it wise to trade Support and Resistance without knowing what those levels actually mean? At least I don’t think so.
Let’s talk more below. Subscribe, share, will continue to share best ideas with folks.
Apple DCF Discussion
Apple is going through in interesting phase in its corporate history. Its iPhone sales have flattened out, and the company is relying on juicing profitability because I think it is having trouble growing its revenue pie. The company has the ability to drive incremental margin gains, but you can only move margins up so high before competitive forces comes in to revert it back lower.
Conclusion is that Apple is one of the higher risk stocks within Mag 7, as will be shown below.
Let’s dive in and look at the big picture changes to estimates for Revenue (top-line), EBITDA (profitability), and Margins (levers that determine How profitable). These are the areas where I focus most of my attention.
Exhibit 1: DCF Core Figures from 2023

Exhibit 2: DCF Core Figures in Late Winter 2024

Here are the conclusions that I’m drawing
Wall Street Consensus Revenue estimates have been cutting Apple revenue forecasts when compared to my 2023 DCF. The revenue cuts are rather steep, looking to be a full 10% below where estimates were just a year ago.
Revenue Growth RATES estimates have also been downgraded lower from the 7-8% profile to the 4-6% profile. 2028 is a special case where the Street expected 15% revenue growth from the Apple Car. However, that is no longer happening and estimates will have to be adjusted. See below.

This explains the “15%” revenue growth estimate in 2028 shown in Exhibit 2. EBITDA estimates is where Apple sees some favorable update, with estimates mostly moving up in the coming 2 years before flattening out in the final 2 terminal years.
EBITDA margin forecasts from 2024-2026 have been upgraded from the 32% region to the 34% region. In other words, Apple is fighting for every last basis point of margin expansion because they know they can’t easily grow revenue at the same rapid clip significantly from here. They have to rely on Profitability.


Shown above is Apple’s profitability (EBITDA margin is a good proxy) profile where the firm appears to be levering all internal resources to drive stronger margins. Given Apple’s business model, I do not believe that margin expansion will come that easily from here on out, and margin expansion upside is probably limited to its historical highs of 36%. That’s only another 150 basis points from here.
Generative AI initiatives will take time to play itself out into Apple’s margins because the lionshare of profits for the foreseeable future come from the Services division as well as the hardware (iPhone, Mac, iPad) division.
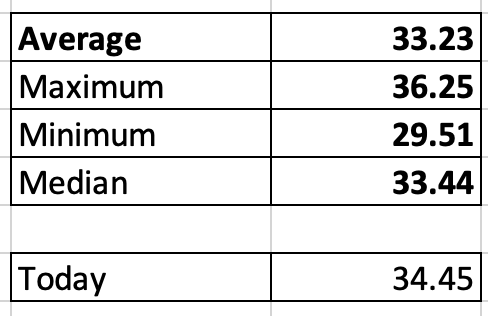
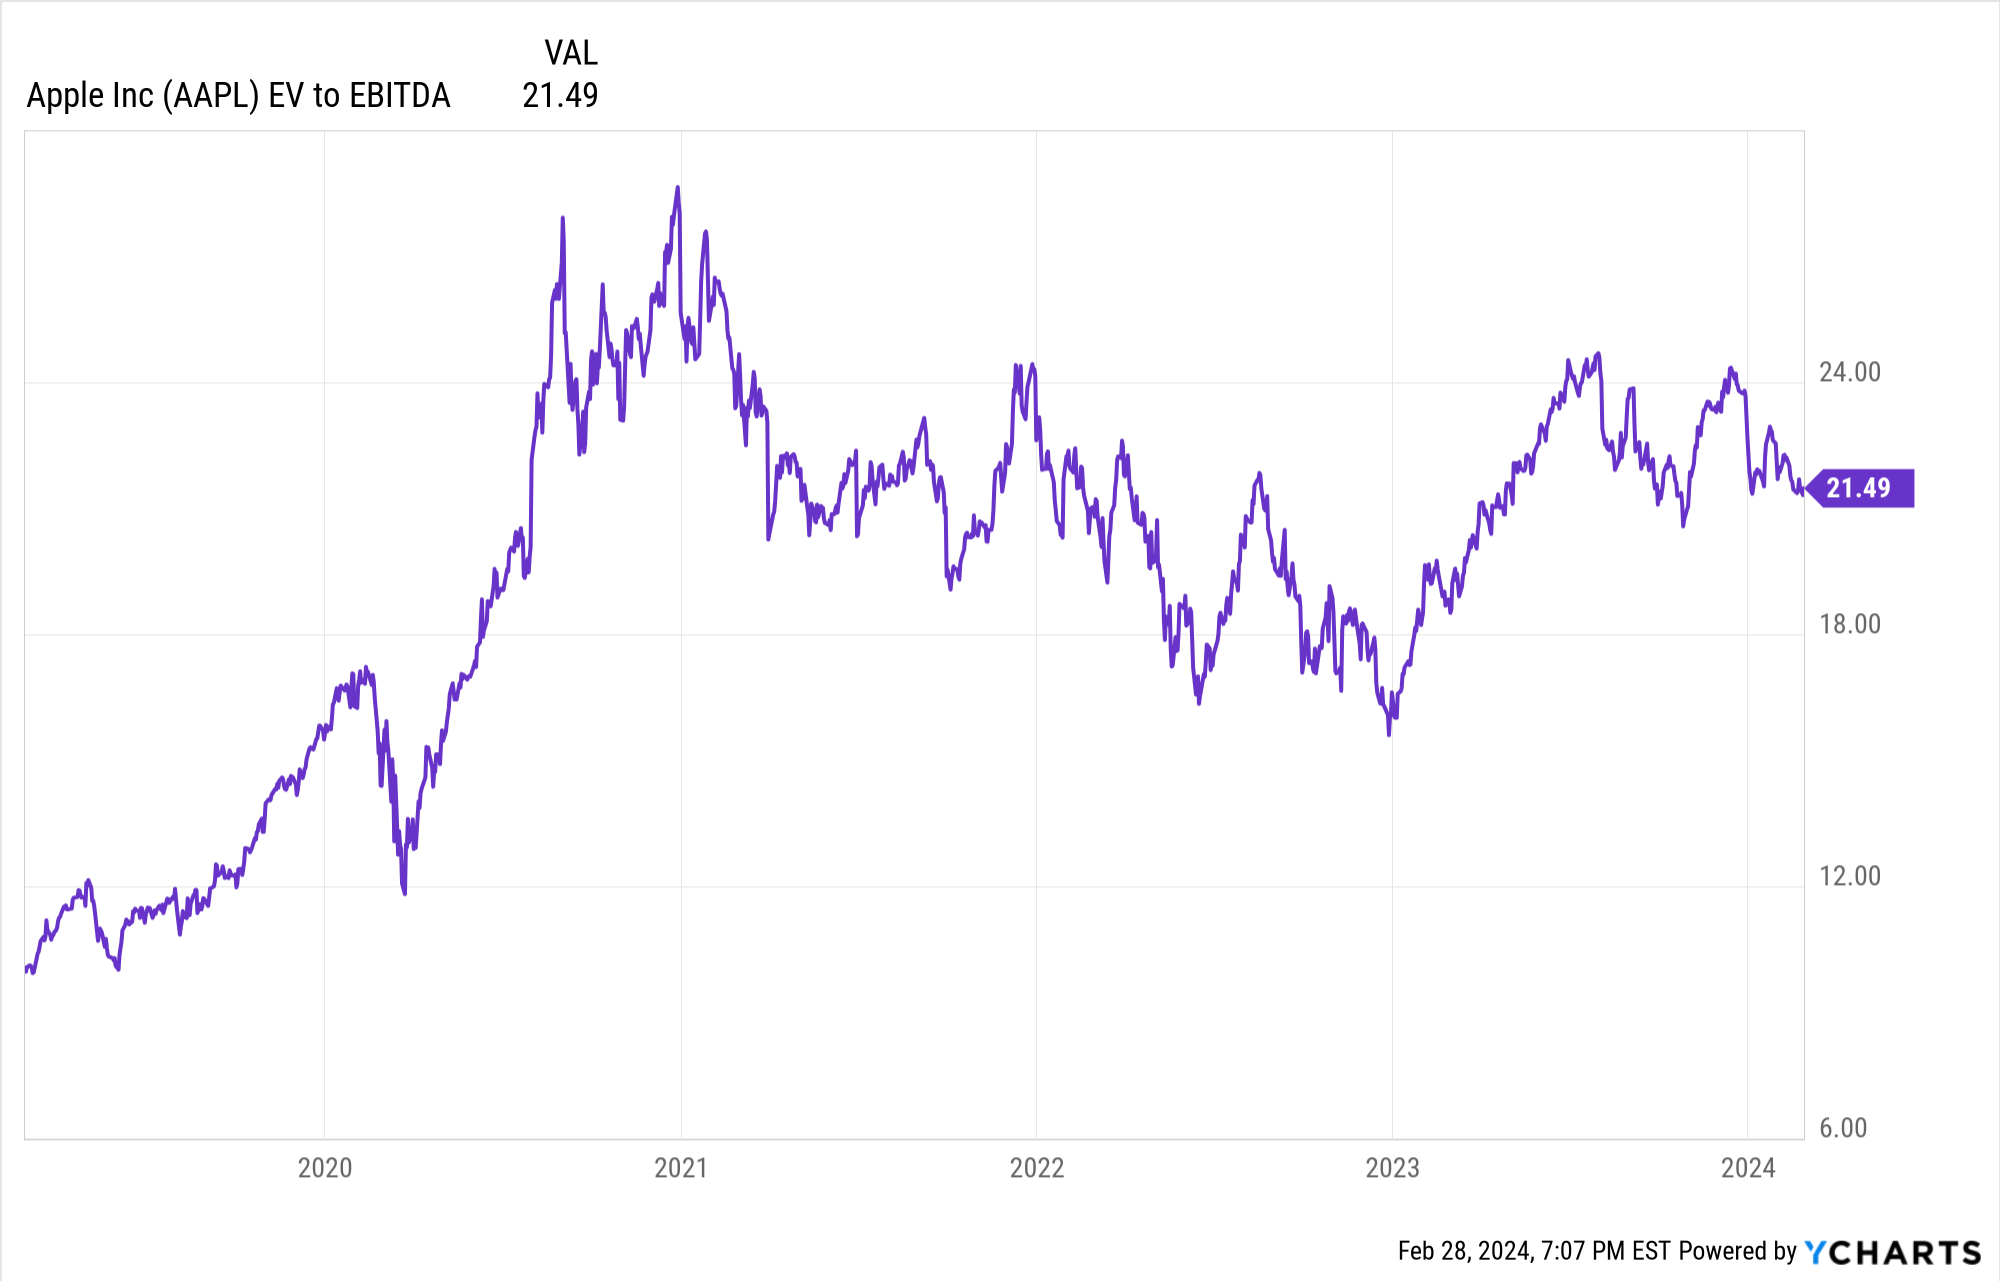
Historical Valuation Data for AAPL EV/EBITDA
Here is the historical range of AAPL EV/EBITDA multiple over a 10 year period.
Today it is 21.48X
Average is around 22.4X

DCF Model Outcomes/Scenario Analysis:
The most important inputs in my opinion are 1.) Top Line Growth (Sales) 2.) EBITDA Margins (profitability) and 3.) Valuation Multiple EV/EBITDA (what Investors Pay).
In all scenarios below, I will assume Wall Street Revenue estimates are accurate. The inputs that I change are EBITDA Margins and the EV/EBITDA Multiple. Changing revenue estimates do not move the needle by that much.
For Apple, it is important to note that every basis point for EBITDA margins counts. This is because it is essentially the core driver of its stock price going forward. We can’t expect revenue growth to grow at the same clip as previously.
I am going to be conservative and NOT use any EV/EBITDA valuation multiple higher than today’s level for most scenarios.
I will only give valuation expansion in one scenario (Scenario 4).
Scenario 1 Assumptions:
Wall Street Revenue Estimates for 2027-2028 are accurate
Terminal Year EBITDA margins are between 34.1%-34.4%% (Street Base Case for Apple’s future, toggle between 34.1, 34.2, 34.3, and 34.4)
Apply a 20X EV/EBITDA multiple (same as today)
174-179/Share (34.1% represents 174/share. 34.4% represents 179/share)
Scenario 2 Assumptions:
Wall Street Revenue Estimates are accurate
Terminal year EBITDA Margins are 33% (historical average levels and not the Street’s 34%+ forecast)
Apply 19X EV/EBITDA multiple (Median level out of conservatism)
155-158/Share
Scenario 3 Assumptions
Wall Street Revenue Estimates are accurate
Terminal Year EBITDA Margins are 33.5% (roughly between last Fiscal Year 33% and next Fiscal Year 34%)
Apply 21.5X EV/EBITDA multiple (today’s level)
~175/share
Scenario 4 Assumptions
Wall Street Revenue Estimates are accurate
Terminal Year EBITDA Margins are 34% (Street Expectation)
Apply 24X EV/EBITDA multiple (mid-point between historical average of 22.4% and corporate High of 28%)
195-197/share
Note: This scenario is entirely dependent on valuation expansion.
Commentary:
Apple’s stock price is now extremely, extremely sensitive to EBITDA margin fluctuations in my opinion. Because revenue has essentially stalled, the driving force for the stock is its profitability profile.
In most scenarios above, I find the stock to be about 2-3% overvalued compared to scenarios 1 & 3. Only in scenario 4, where I had to give benefit of the doubt with multiple expansion from 21.5X today to 24X will I get a higher value of 195-197.
Returning to historical levels in terms of profitability and valuation may result in a 10% correction for the company.
The company’s upside targets rely on Multiple Expansion and Margin Expansion.

I had previously shared that I believed Apple could revisit 188 within 3 months about a week ago. I cautiously still think that will be true.
However, If the stock takes out 175-177 on the downside, my forecast on 188 was too optimistic and most likely the stock will target 170 first, and then subsequently 160 (approach/gravitate towards Scenario 2). 188 will eventually come, but may be delayed.
With this DCF, I can conclude that within the Mag 7, Apple is the bigger relative risk.
I don’t think the biggest Mag7 risk is AMZN, and the risk isn’t so much with MSFT either (fundamentally).
I’ll be following along, and keeping folks updated.
-Larry