Note: Thank you to Interactive Brokers for being my partner Brokerage where we get 4.8% Yield on Idle Cash which accrues daily. Today’s note is public to all.
Hi Everyone,
A bit of fundamental analysis today to explain today’s context. Overnight in Asia, TSM (Taiwan Semi Manufacturing Company) released a 2024 forecast that they would see 20% revenue growth for the full year. Specifically, the firm discussed that its 3NM technology is seeing a strong ramp up and that it believes Q1 2024 revenues to be $18B-$18.8B compare to consensus estimates of $18.2B.
The high end of the range is about 3% higher than consensus, and the Stock is trading about 7% higher. My observation is that when a stock’s advance trades higher than the high end of the range (as a percentage) over consensus, this means the Buy Side expects results even better than $18.8B in the coming quarter. So, expectations are raised for TSM and so is positive sentiment.
Now, in terms of how this flows into the semiconductor ecosystem, the wafer equipment industry (WFE) is sub-sector of Semiconductors where several equipment makers such as KLAC, Lam Research, Applied Materials, and ASML take up the lion share of WFE industry revenue. You can read more about that in my public commentary on Lam Research, a company along with Applied Materials that I follow to understand Semis.
Both Lam and Applied Materials have a very concentrated client base, and TSM is one of their big clients. As discussed in Lam’s company overview, a rising outlook in its Clients (Samsung, TSM, Intel, Micron, Yangtze, etc) due to its concentrated customer base means that the capital expenditure environment continues to be well-bid. And this translates directly into a stronger fundamental outlook for Lam (Lam and AMAT, both +3% today). When your clients do well, so do you.
This applies in business. This also applies to stocks, since they are proxies of business health after all.
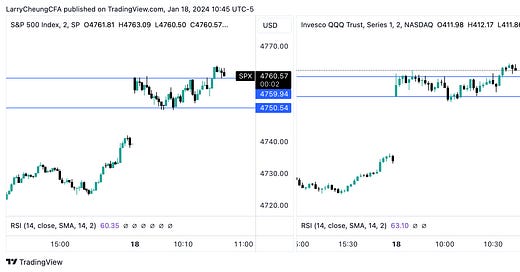
I believe today’s nice advance is largely attributed to the sentiment lift in Semiconductors led by TSM. We can see below on an intraday basis that U.S. markets gapped up, representing both a follow through from yesterday’s recovery added with the overnight favorable developments.
In order for long-term sellers to drive market lower, we will need to see earnings per share estimates and outlooks get cut. Vice-versa is true for buyers (need to see EPS/Outlook rise). At present, supports are strong and resistance is weak. This is because corporate fundamentals (on the surface) continue to be resilient.
Below, I’ll share thinking on market structure on semiconductors as they are currently the market leader. The market will follow their lead, so understanding them will further explain context.
Key Players within Semis.
These are the intraday charts of AMAT/LRCX - the pick & shovels to the Semiconductor industry. As long as these two companies stay well bid, I expect QQQ corrective sessions to have limits (meaning that deep sells are bought up intraday). Together, in my opinion, these two companies are more predictive of future moves in NQ/QQQ and SOXX than AMD/NVDA. This is because they represent the back-end of the supply chain whereas AMD/NVDA represents the front end market. In other words, if AMAT/LRCX sell off and AMD/NVDA rallies, I weigh the AMAT/LRCX action more. Conversely is also true.
We can see here that AMAT/LRCX today are well bid.
Whereas AMD/NVDA are approximately flat from the open.
That being said, Semiconductors cannot carry the entire market indefinitely. Continued weakness in these two proxies RSP Equal Weight ETF and Small Cap Russell 2000 will manifest itself into a sluggish SPY/SPX reading down the line.
We can see from above that RSP (which represent “most stocks” in SPX) and IWM Small Caps (which represent small-medium size enterprises) are unable to have even one tick above its opening print. Not even one.
Conclusion is that the entire market is carried by semiconductors.
So, either the market starts seeing follow through from other sectors to maintain the push higher or we are near an area where powerful sellers can see through the weak breadth and make their next move.
In past several Daily Notes, I’ve included more chart structures to help folks visualize what I look at. Let me know if this format is helpful to you via an engagement like/share.
Your support is highly valuable to us. Will continue to innovate for my readers.
Have a great weekend.
Larry
Disclaimer: My investment community is not investment, financial, or trading advice, but for educational informational purposes only. I am happy to share my personal opinions which I provide as my personal journal. Trading of any kind of securities involves a lot of risk. No guarantee of any profit whatsoever is made. Investors may lose everything they have. Practice extreme caution. No profit is guaranteed whatsoever, You assume the entire cost and risk of any trading or investing activities you choose to undertake. You are solely responsible for making your own investment decisions. Owners/authors of this publication are NOT registered as securities broker-dealers or investment advisors either with the U.S. SEC, CFTC or with any other securities/regulatory authority. Make sure to consult with a registered investment advisor, broker-dealer, and/or financial advisor.


